MU Perpetual: A pullback is still likely after the rebound; watch level: MU 1,056.88 USDT
Over the next 1–4 hours, I’m leaning toward MU Perpetual pulling back after its rebound. The first level to watch is MU 1,056.88 USDT; when price approaches it, I’ll reassess support and volume. Getting itchy to trade? Let price clear this hurdle first. 🙃
This analysis is based on the Binance MUUSDT perpetual contract. Quotes are in USDT, and both the chart and volume data come from this contract. MU Perpetual is currently around 1,059.36 USDT, down 1.89% over 24 hours and 2.04% from the high for this window. This retracement makes me more focused on whether a rebound can hold. Until price reclaims a key level, I’ll treat the bounce as a recovery, not rush to call a reversal.
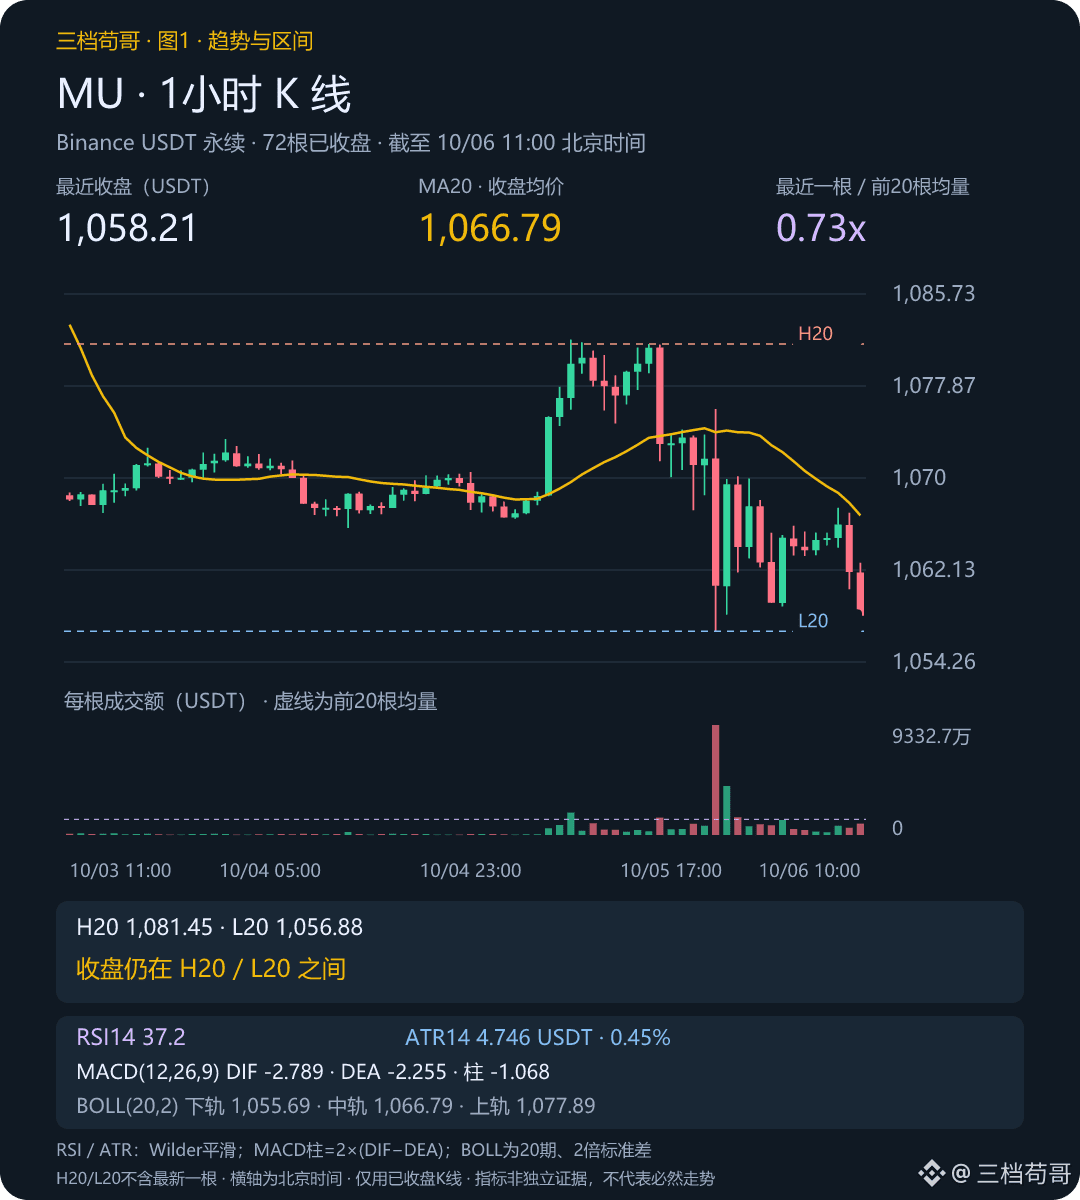
📊 Chart 1 | 1-hour, through 11:00 Beijing time: The close remains within the range of the previous 20 bars. MA20 has moved lower over the last 3 bars, and the close is below it. Volume is 0.73 times the average of the previous 20 bars, suggesting weak volume; don’t expect momentum to build too quickly.
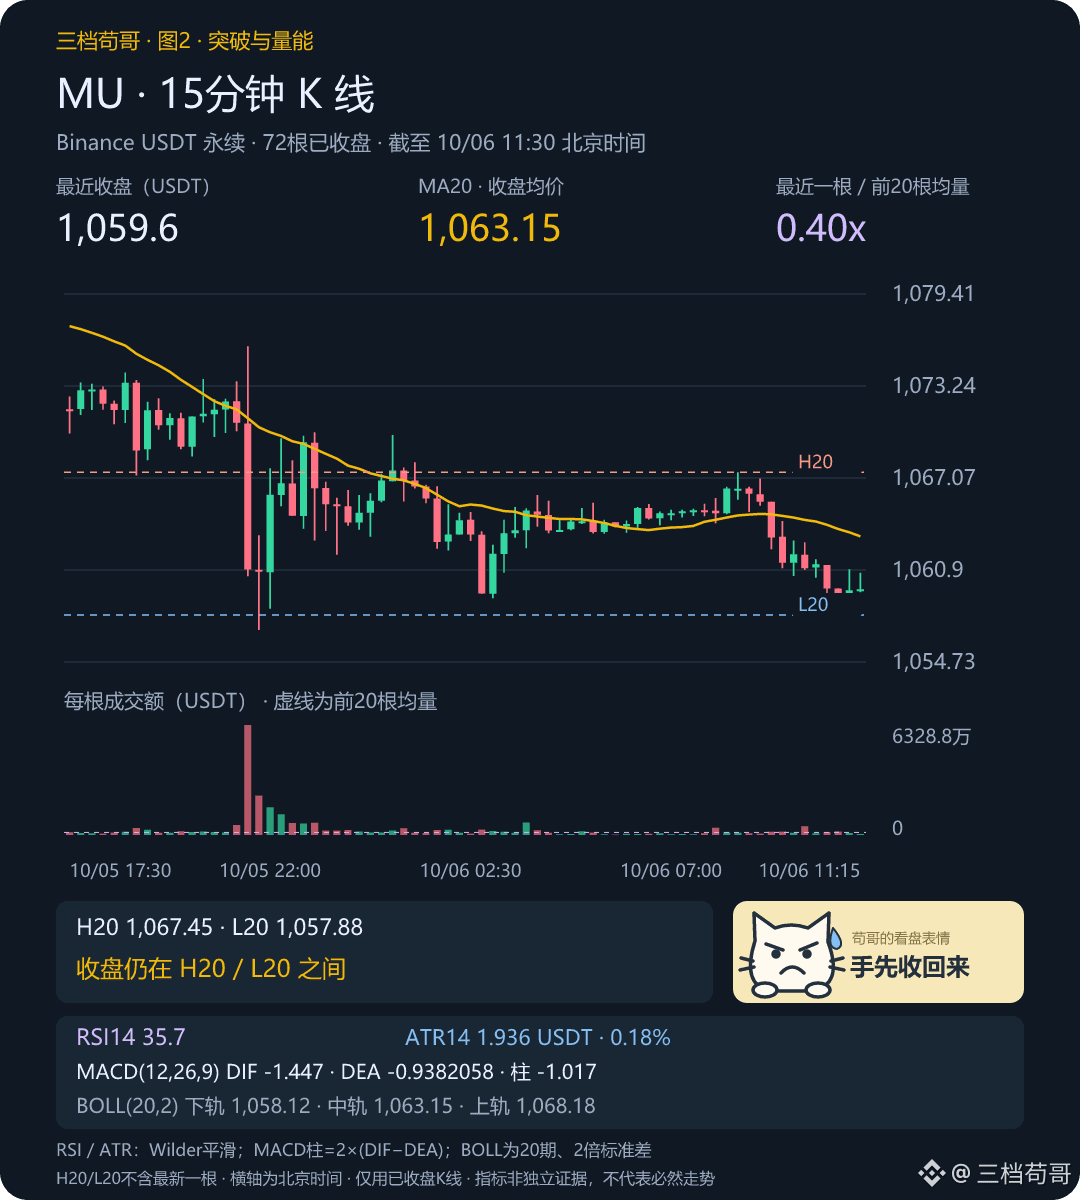
🔎 Chart 2 | MU 15-minute, through 11:30 Beijing time: The close is below MA20, volume is 0.40 times average, and MA20 has moved lower over the last 3 bars. The shorter timeframe isn’t showing any clear disagreement. First, let’s see whether this alignment holds through the next close.
🧭 RSI14 is 37.2, and the MACD negative histogram bars are expanding: momentum is bearish, and a rebound still needs price confirmation. ATR14 is 4.75 USDT, about 0.45% of the closing price, and is used to gauge the potential range of volatility.
→ Main scenario: If the rebound fails to reclaim MU 1,066.79 USDT, price is more likely to test MU 1,056.88 USDT to the downside. The watch level is the low of the latest 20 completed candles (including the most recent one). Once price nears it, I’ll reassess the strength of any breakout.
⚠️ If the next 1-hour candle closes back above MU 1,066.79 USDT, I’ll withdraw the original view and instead watch MU 1,081.45 USDT. A wick touching the level doesn’t count; reassess if the time window has passed.
🧭 Market sentiment | Binance MU: Funding rate snapshot: 0.0000% (not annualized); 4h open interest: -1.21%. The sample is insufficient, so I’m not making a call on sentiment direction for now. These are derivatives positioning and trading-sentiment proxies, not a survey of sentiment across the entire market. Data timestamps (Beijing time): funding rate, 2026/10/6 11:37:15; OI through 2026/10/6 11:00:00. Some metrics are unavailable and have not been filled in with outdated values.
💥 Liquidation data | MU: As of 2026/10/6 11:37:16 Beijing time, no valid two-way liquidation model was available, so I can’t provide amounts corresponding to upside or downside price levels. Missing data does not mean zero, nor can it be used to infer “which side the market maker will liquidate.”
💬 Do you agree that a further pullback is likely, or do you see signs that the decline is stabilizing? Let’s also discuss which piece of evidence on the chart supports your view.
To keep following along, check the MU market data below against the conditions above.
Source: Binance USDT perpetual | Rolling 24 hours | 2026/10/6 11:37:14 Beijing time.
For discussion only; not investment advice.
$BTC $ETH $MU
Over the next 1–4 hours, I’m leaning toward MU Perpetual pulling back after its rebound. The first level to watch is MU 1,056.88 USDT; when price approaches it, I’ll reassess support and volume. Getting itchy to trade? Let price clear this hurdle first. 🙃
This analysis is based on the Binance MUUSDT perpetual contract. Quotes are in USDT, and both the chart and volume data come from this contract. MU Perpetual is currently around 1,059.36 USDT, down 1.89% over 24 hours and 2.04% from the high for this window. This retracement makes me more focused on whether a rebound can hold. Until price reclaims a key level, I’ll treat the bounce as a recovery, not rush to call a reversal.
📊 Chart 1 | 1-hour, through 11:00 Beijing time: The close remains within the range of the previous 20 bars. MA20 has moved lower over the last 3 bars, and the close is below it. Volume is 0.73 times the average of the previous 20 bars, suggesting weak volume; don’t expect momentum to build too quickly.
🔎 Chart 2 | MU 15-minute, through 11:30 Beijing time: The close is below MA20, volume is 0.40 times average, and MA20 has moved lower over the last 3 bars. The shorter timeframe isn’t showing any clear disagreement. First, let’s see whether this alignment holds through the next close.
🧭 RSI14 is 37.2, and the MACD negative histogram bars are expanding: momentum is bearish, and a rebound still needs price confirmation. ATR14 is 4.75 USDT, about 0.45% of the closing price, and is used to gauge the potential range of volatility.
→ Main scenario: If the rebound fails to reclaim MU 1,066.79 USDT, price is more likely to test MU 1,056.88 USDT to the downside. The watch level is the low of the latest 20 completed candles (including the most recent one). Once price nears it, I’ll reassess the strength of any breakout.
⚠️ If the next 1-hour candle closes back above MU 1,066.79 USDT, I’ll withdraw the original view and instead watch MU 1,081.45 USDT. A wick touching the level doesn’t count; reassess if the time window has passed.
🧭 Market sentiment | Binance MU: Funding rate snapshot: 0.0000% (not annualized); 4h open interest: -1.21%. The sample is insufficient, so I’m not making a call on sentiment direction for now. These are derivatives positioning and trading-sentiment proxies, not a survey of sentiment across the entire market. Data timestamps (Beijing time): funding rate, 2026/10/6 11:37:15; OI through 2026/10/6 11:00:00. Some metrics are unavailable and have not been filled in with outdated values.
💥 Liquidation data | MU: As of 2026/10/6 11:37:16 Beijing time, no valid two-way liquidation model was available, so I can’t provide amounts corresponding to upside or downside price levels. Missing data does not mean zero, nor can it be used to infer “which side the market maker will liquidate.”
💬 Do you agree that a further pullback is likely, or do you see signs that the decline is stabilizing? Let’s also discuss which piece of evidence on the chart supports your view.
To keep following along, check the MU market data below against the conditions above.
Source: Binance USDT perpetual | Rolling 24 hours | 2026/10/6 11:37:14 Beijing time.
For discussion only; not investment advice.
$BTC $ETH $MU