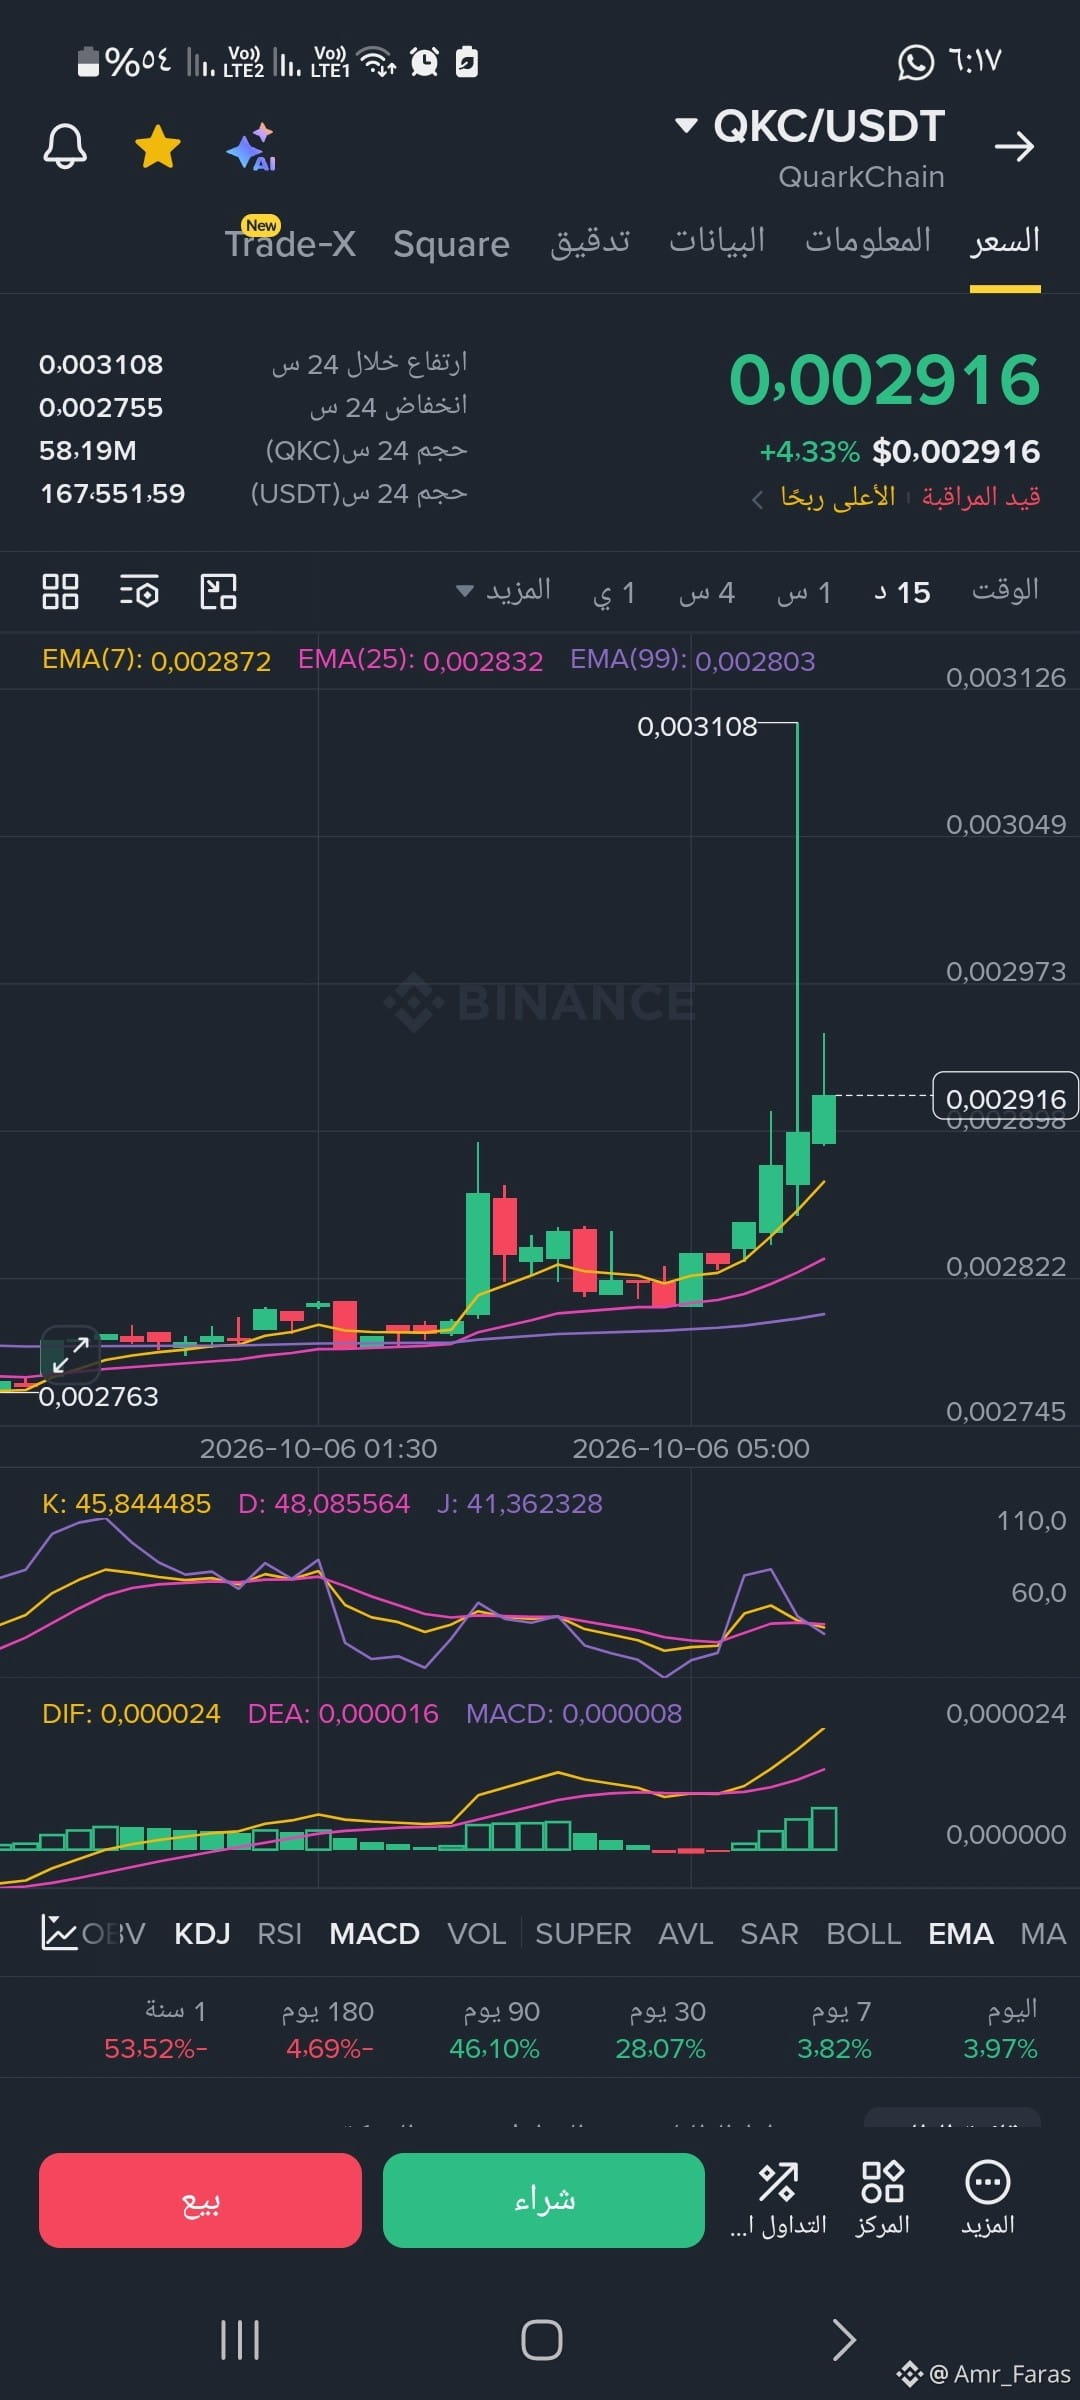
#qkc Price Action and Japanese Candlesticks (Candlesticks)
• Current trend: The chart shows a strong, sudden rise (a very long green candle), indicating a rapid influx of substantial buying liquidity that pushed the price up from 0.002763 to a local peak of 0.003108, before it pulled back slightly and settled at 0.002916.
• Exponential Moving Averages (EMA): The current price is trading above all the moving averages shown:
• EMA(7): 0.002872 (yellow)
• EMA(25): 0.002832 (pink)
• EMA(99): 0.002803 (purple)
• The price being above these averages reinforces short-term bullish momentum, and these levels are currently acting as support zones in the event of a correction.
• Current trend: The chart shows a strong, sudden rise (a very long green candle), indicating a rapid influx of substantial buying liquidity that pushed the price up from 0.002763 to a local peak of 0.003108, before it pulled back slightly and settled at 0.002916.
• Exponential Moving Averages (EMA): The current price is trading above all the moving averages shown:
• EMA(7): 0.002872 (yellow)
• EMA(25): 0.002832 (pink)
• EMA(99): 0.002803 (purple)
• The price being above these averages reinforces short-term bullish momentum, and these levels are currently acting as support zones in the event of a correction.