ETH: Repeated range action; no clear one-way move yet. Key level: ETH 2,734 USDT
Over the next 1–4 hours, I’m leaning toward ETH continuing to move back and forth within a range, with no clear one-way move just yet. First, watch the ETH 2,676.97 USDT–ETH 2,734 USDT range. The price action feels a bit like “you move in, I move out,” so let’s not imagine a major move before it happens. 🫠
ETH is currently around 2,701.58 USDT, down 0.97% over 24 hours and 1.19% from the high during this window. Price changes haven’t established a new directional advantage. Given the mixed signals on the chart, I’d rather interpret what comes next as range-bound for now.
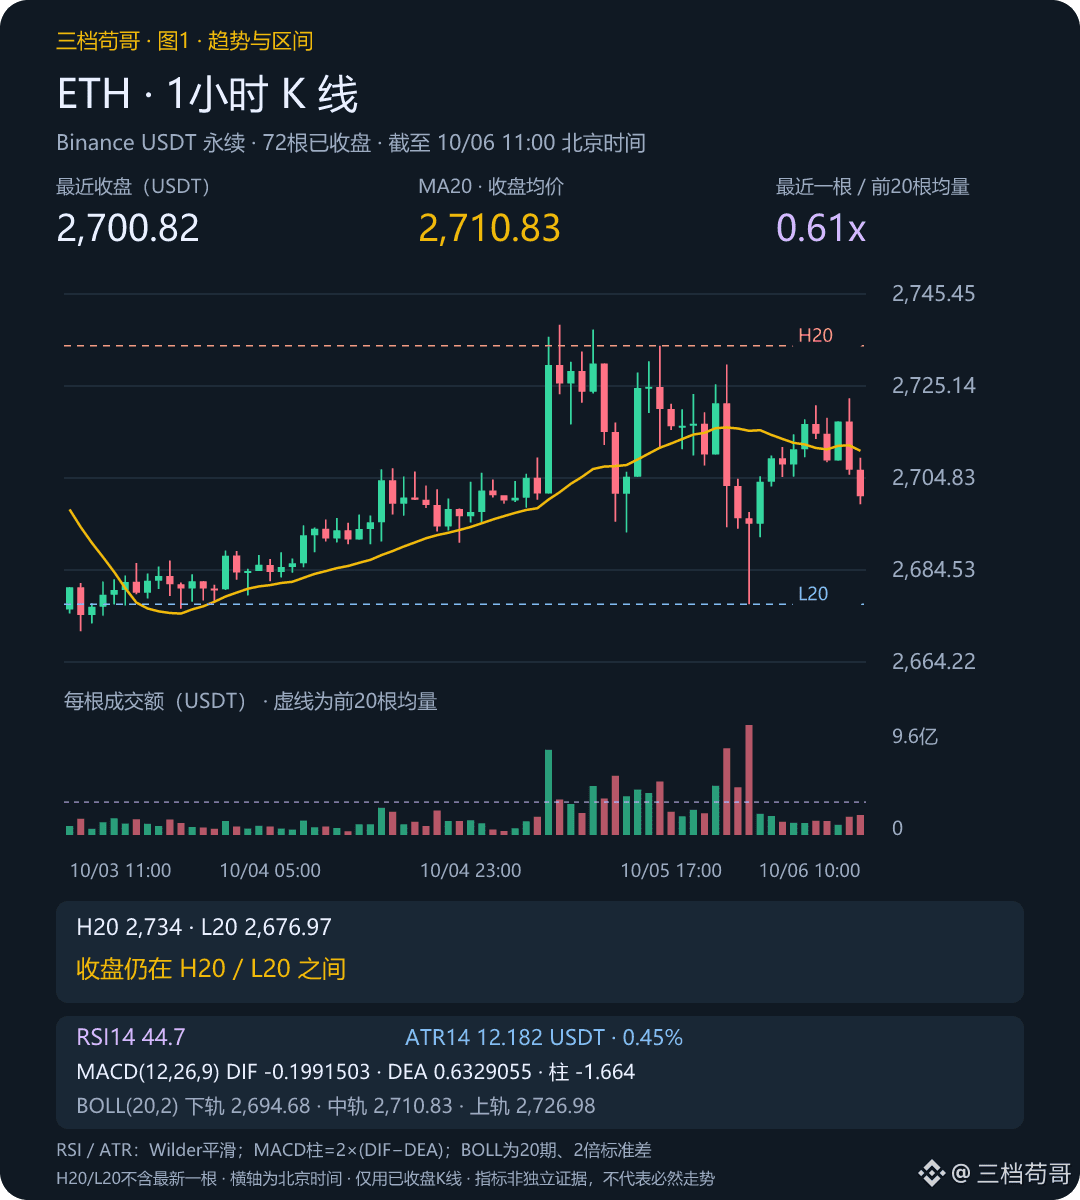
📊 Chart 1 | 1-hour chart, as of 11:00 Beijing time: The close remains within the range of the previous 20 bars. The MA20 has been mostly flat over the last 3 bars, with the close below it; volume is 0.61 times the average of the previous 20 bars, so it’s on the weak side. Don’t expect momentum to carry through too quickly.
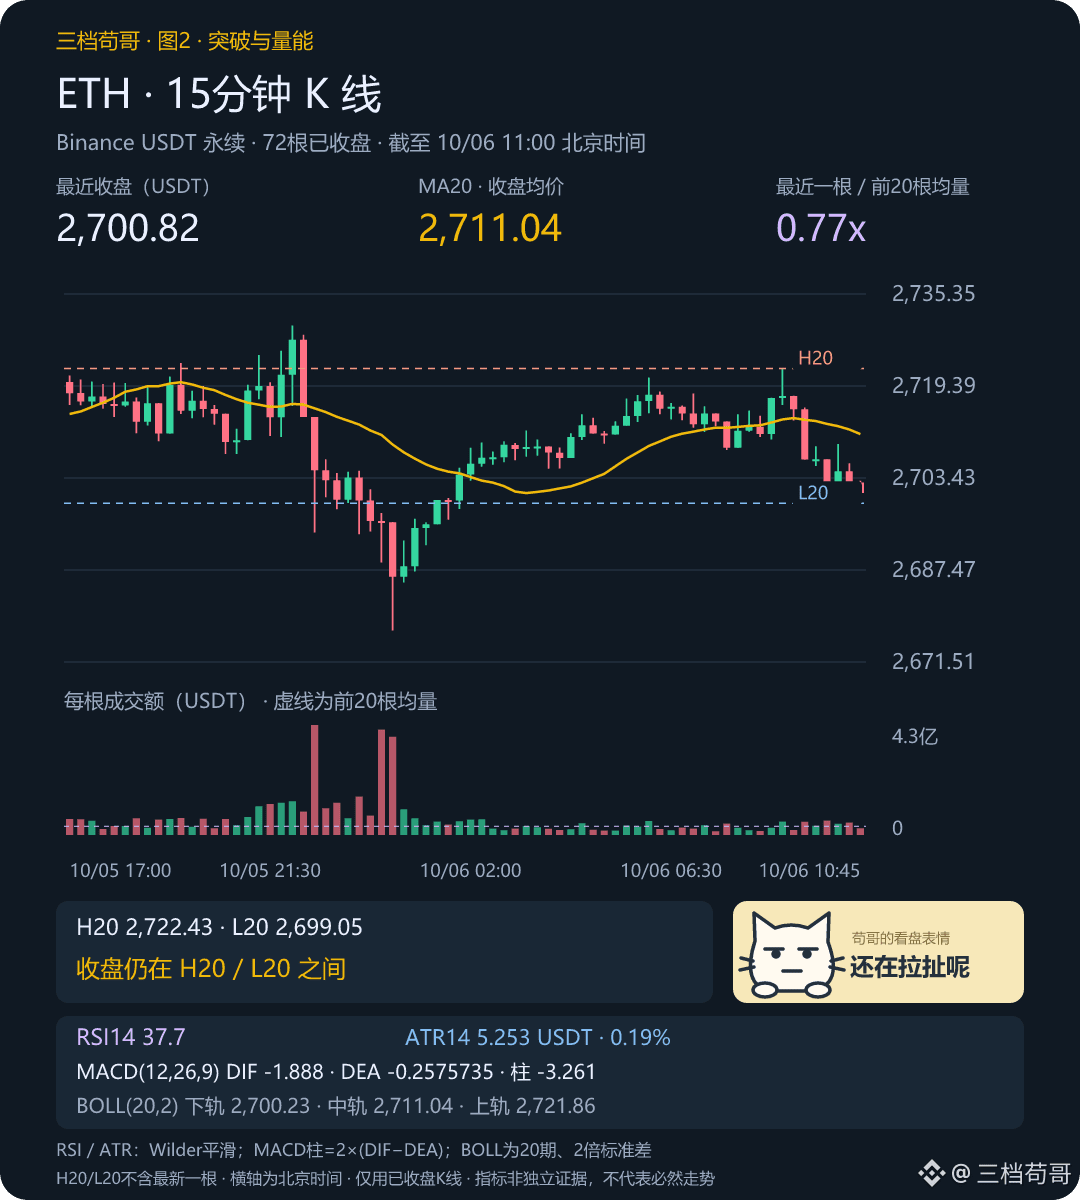
🔎 Chart 2 | ETH 15-minute chart, as of 11:00 Beijing time: The close is below the MA20, volume is 0.77 times average, and the MA20 is still moving down. The shorter timeframe isn’t clearly contradicting this view. First, let’s see whether this alignment continues through the next close.
🧭 RSI14 is 44.7, and the MACD negative bars are expanding: momentum is bearish, and a rebound still needs price confirmation. ATR14 is 12.18 USDT, about 0.45% of the closing price, and can be used to gauge the potential volatility range.
→ The base case is continued back-and-forth movement within the range: if price tests ETH 2,734 USDT but can’t hold above it at the close, it may return toward the middle of the range; if it tests ETH 2,676.97 USDT, watch whether the low holds.
⚠️ Conditions that would change my view: If a subsequent 1-hour close moves above ETH 2,734 USDT or below ETH 2,676.97 USDT, with volume exceeding the average of the previous 20 bars, I’ll switch to watching the breakout direction. Without increased volume, beware of a false breakout and wait for confirmation from the next bar; reassess if the time window expires.
🧭 Market sentiment | Binance ETH: Funding rate snapshot: -0.0012% (not annualized); 4h open interest: +0.03%; active buy/sell volume ratio over the past 1h: 0.77x. Active selling is dominant; rising open interest indicates increased leveraged participation, but direction still needs price confirmation. These are proxies for derivatives positioning and trading sentiment, not a survey of market-wide public opinion. Data timestamps (Beijing time): funding rate 2026/10/6 11:06:14; OI as of 2026/10/6 11:00:00; active trade sample 2026/10/6 10:00:00.
💥 Liquidation data | ETH, 2026/10/6 11:05:00 Beijing time, Datawallet Binance 24h model: Starting at 2,700.48, a 2% rise to 2,754.4896 would encounter estimated cumulative short liquidation intensity of about US$151.07 million; a 2% drop to 2,646.4704 would encounter estimated cumulative long liquidations of about US$127.146 million. These figures are accumulated for a single time slice only; they are not actual liquidation totals across the entire market, nor amounts guaranteed to be liquidated at those prices. The larger side indicates a potential acceleration zone, but the figures alone cannot determine direction.
💬 Do you think ETH will keep ranging, or will the next close pick a direction? Feel free to share which piece of evidence on the chart informs your view.
If you want to keep following along, you can check the ETH market data below against the conditions above.
Source: Binance USDT perpetual | Rolling 24 hours | 2026/10/6 11:06:13 Beijing time.
For discussion only; not investment advice.
$BTC $ETH $龙虾
Over the next 1–4 hours, I’m leaning toward ETH continuing to move back and forth within a range, with no clear one-way move just yet. First, watch the ETH 2,676.97 USDT–ETH 2,734 USDT range. The price action feels a bit like “you move in, I move out,” so let’s not imagine a major move before it happens. 🫠
ETH is currently around 2,701.58 USDT, down 0.97% over 24 hours and 1.19% from the high during this window. Price changes haven’t established a new directional advantage. Given the mixed signals on the chart, I’d rather interpret what comes next as range-bound for now.
📊 Chart 1 | 1-hour chart, as of 11:00 Beijing time: The close remains within the range of the previous 20 bars. The MA20 has been mostly flat over the last 3 bars, with the close below it; volume is 0.61 times the average of the previous 20 bars, so it’s on the weak side. Don’t expect momentum to carry through too quickly.
🔎 Chart 2 | ETH 15-minute chart, as of 11:00 Beijing time: The close is below the MA20, volume is 0.77 times average, and the MA20 is still moving down. The shorter timeframe isn’t clearly contradicting this view. First, let’s see whether this alignment continues through the next close.
🧭 RSI14 is 44.7, and the MACD negative bars are expanding: momentum is bearish, and a rebound still needs price confirmation. ATR14 is 12.18 USDT, about 0.45% of the closing price, and can be used to gauge the potential volatility range.
→ The base case is continued back-and-forth movement within the range: if price tests ETH 2,734 USDT but can’t hold above it at the close, it may return toward the middle of the range; if it tests ETH 2,676.97 USDT, watch whether the low holds.
⚠️ Conditions that would change my view: If a subsequent 1-hour close moves above ETH 2,734 USDT or below ETH 2,676.97 USDT, with volume exceeding the average of the previous 20 bars, I’ll switch to watching the breakout direction. Without increased volume, beware of a false breakout and wait for confirmation from the next bar; reassess if the time window expires.
🧭 Market sentiment | Binance ETH: Funding rate snapshot: -0.0012% (not annualized); 4h open interest: +0.03%; active buy/sell volume ratio over the past 1h: 0.77x. Active selling is dominant; rising open interest indicates increased leveraged participation, but direction still needs price confirmation. These are proxies for derivatives positioning and trading sentiment, not a survey of market-wide public opinion. Data timestamps (Beijing time): funding rate 2026/10/6 11:06:14; OI as of 2026/10/6 11:00:00; active trade sample 2026/10/6 10:00:00.
💥 Liquidation data | ETH, 2026/10/6 11:05:00 Beijing time, Datawallet Binance 24h model: Starting at 2,700.48, a 2% rise to 2,754.4896 would encounter estimated cumulative short liquidation intensity of about US$151.07 million; a 2% drop to 2,646.4704 would encounter estimated cumulative long liquidations of about US$127.146 million. These figures are accumulated for a single time slice only; they are not actual liquidation totals across the entire market, nor amounts guaranteed to be liquidated at those prices. The larger side indicates a potential acceleration zone, but the figures alone cannot determine direction.
💬 Do you think ETH will keep ranging, or will the next close pick a direction? Feel free to share which piece of evidence on the chart informs your view.
If you want to keep following along, you can check the ETH market data below against the conditions above.
Source: Binance USDT perpetual | Rolling 24 hours | 2026/10/6 11:06:13 Beijing time.
For discussion only; not investment advice.
$BTC $ETH $龙虾