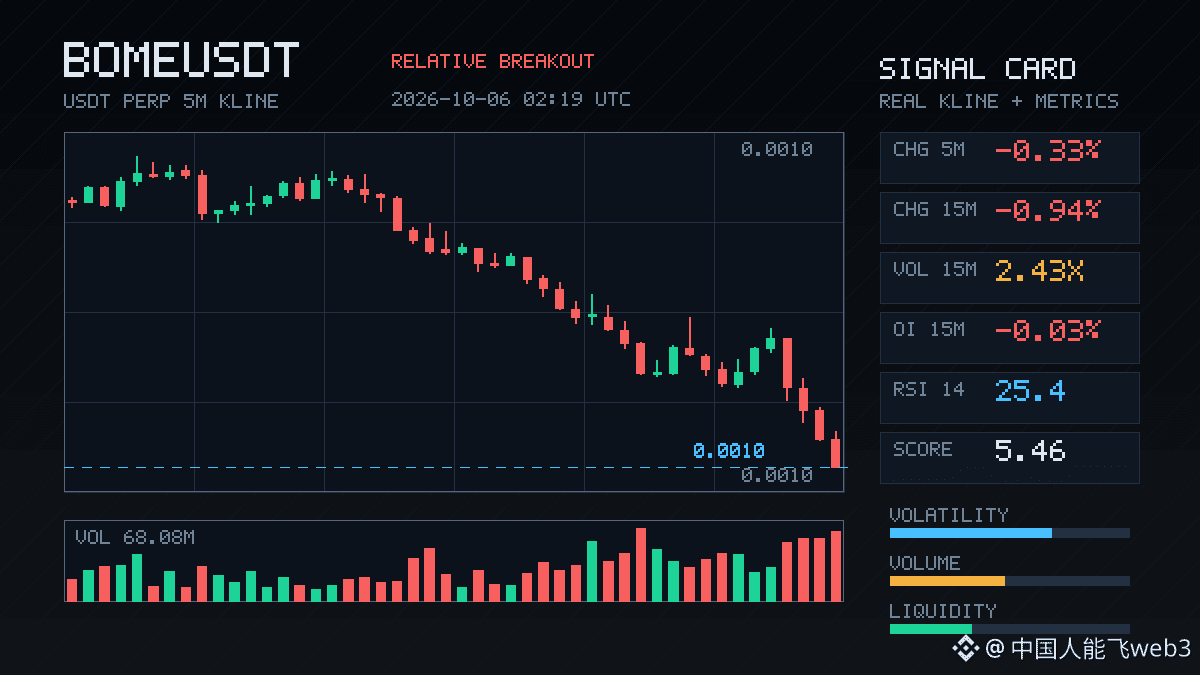
$BOME — this 15m candle is interesting.
Price fell by less than 1 point, but volume surged to 2.43x, volatility Z shot straight up to 2.70, and the close broke below the lows of nearly 20 recent 5m candles. On the surface, it looks like a decline, but OI tells a different story: 15m -0.03%, 1h +0.40%, with nominal changes both negative: -84K and -62K.
Price down, OI down—that’s not new shorts entering. It looks more like longs deleveraging, stop-losses getting triggered, and positions shrinking. Aggressive trade delta is -13%, the buy/sell ratio is 0.77, and sellers are in control. But the funding rate is still near the upper end of its recent range, and the OI anomaly percentile is 96.4%, ranking 6th across the entire pool.
This is a pretty typical setup: leverage is piled on too heavily, and once price breaks the boundary, longs start stampeding for the exits. It’s not that the bears are especially fierce—the longs are just rushing out.
24h trading volume is only 10.48M, so the pool isn’t particularly deep. If OI keeps falling and price doesn’t rebound, this move is simply a position flush. If OI stabilizes and volume subsides, though, that could instead signal a short-term bottom.
First, watch whether this 15m candle can reclaim the lower edge of the range. If it can’t, there may be more grinding ahead below.
Price fell by less than 1 point, but volume surged to 2.43x, volatility Z shot straight up to 2.70, and the close broke below the lows of nearly 20 recent 5m candles. On the surface, it looks like a decline, but OI tells a different story: 15m -0.03%, 1h +0.40%, with nominal changes both negative: -84K and -62K.
Price down, OI down—that’s not new shorts entering. It looks more like longs deleveraging, stop-losses getting triggered, and positions shrinking. Aggressive trade delta is -13%, the buy/sell ratio is 0.77, and sellers are in control. But the funding rate is still near the upper end of its recent range, and the OI anomaly percentile is 96.4%, ranking 6th across the entire pool.
This is a pretty typical setup: leverage is piled on too heavily, and once price breaks the boundary, longs start stampeding for the exits. It’s not that the bears are especially fierce—the longs are just rushing out.
24h trading volume is only 10.48M, so the pool isn’t particularly deep. If OI keeps falling and price doesn’t rebound, this move is simply a position flush. If OI stabilizes and volume subsides, though, that could instead signal a short-term bottom.
First, watch whether this 15m candle can reclaim the lower edge of the range. If it can’t, there may be more grinding ahead below.