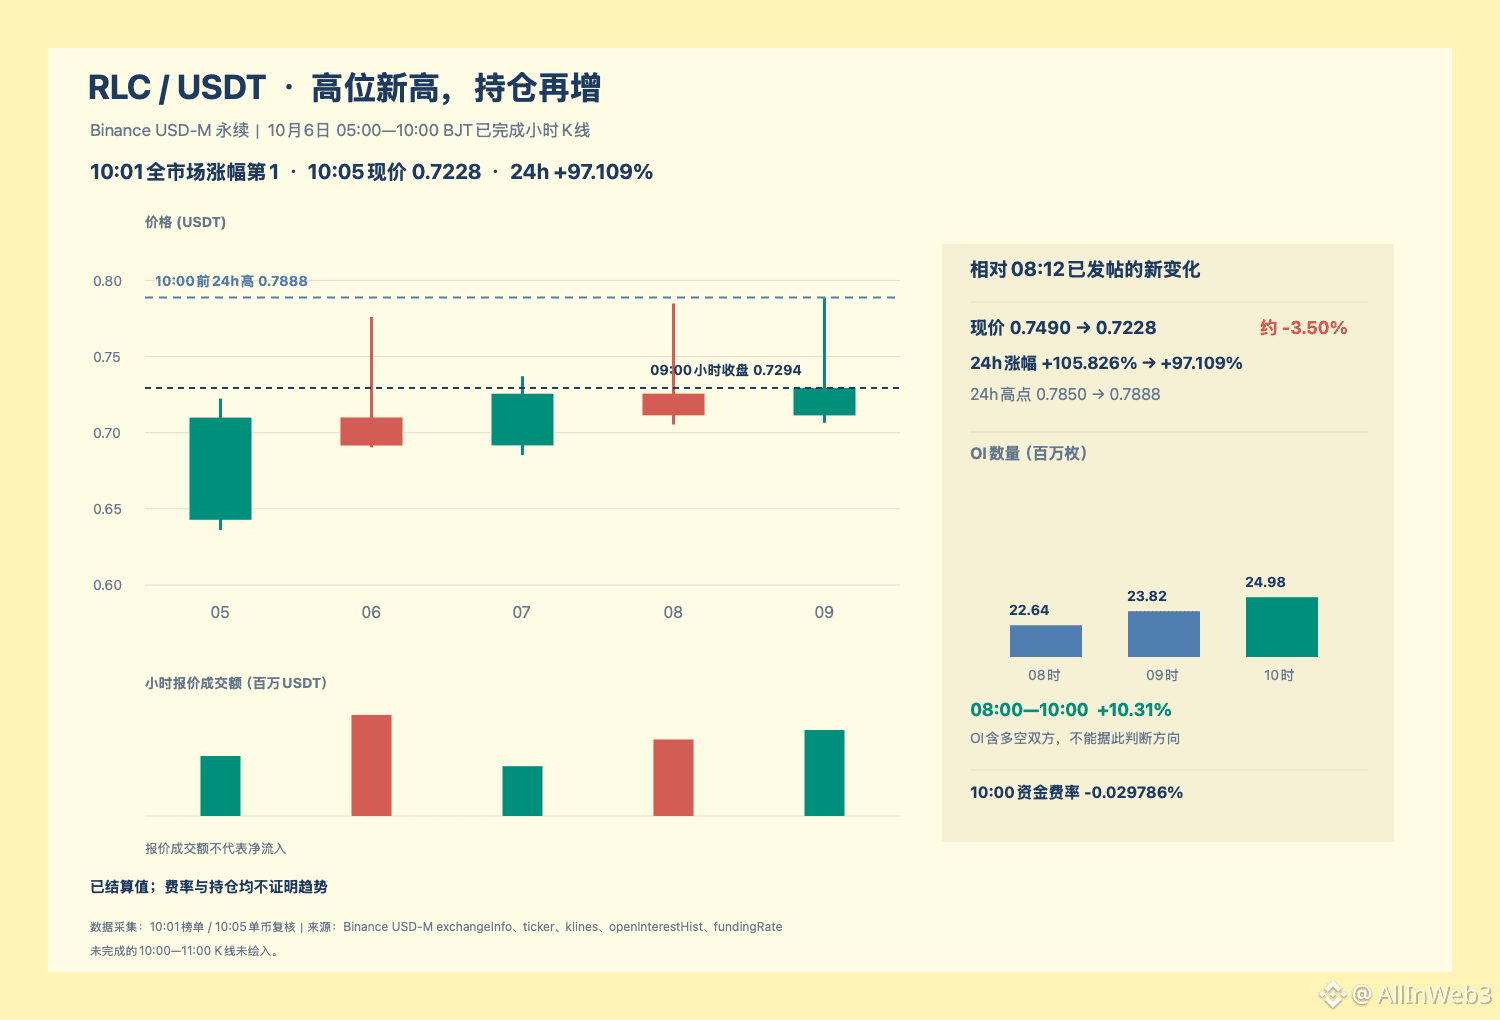
$RLC remains ranked No. 1 on Binance’s USDT perpetual gainers list, but this round of additional gains looks more like a “high-price/positioning divergence” than confirmed trend strength. The full scan at 10:15:24 Beijing time covered 523 contracts within scope. RLC was up 95.123%, with a last price of 0.7282 and approximately $625 million in 24-hour quote volume. Compared with the 0.7490 price and +105.826% recorded in the post published at 08:12 (ID 374187742672049), the current price is about 2.78% lower, while the rolling gain has fallen by 10.703 percentage points.
During the 10:05 single-asset review, the 24-hour high had risen from 0.7850, recorded in the previous post, to 0.7888. The two most recent completed hourly candles both had relatively long upper wicks: from 08:00 to 09:00, the price closed at 0.7114 after starting at 0.7257; from 09:00 to 10:00, it opened at 0.7114, reached a high of 0.7888, and ultimately closed at 0.7294—about 7.53% below that hour’s high. After testing higher intrahour, the price retreated by the close; the new high should not be treated as a confirmed hold above that level.
Another change is open interest: Binance’s OI quantity sample rose from about 22.645 million tokens at 08:00 to about 24.980 million at 10:00, an increase of approximately 10.31%, while the price fell compared with the previous post. This indicates growing futures market participation, but does not distinguish between longs and shorts, nor does it prove net inflows or a short squeeze. How these position changes are absorbed over subsequent completed hourly candles matters more. The funding rate settled at 10:00 was -0.029786% (raw decimal -0.00029786), still negative, but the funding rate likewise cannot identify position direction.
No new announcement from the official iExec blog was found this round that coincided with the sharp rise on October 6, so the old roadmap is not being presented as a catalyst. Going forward, watch whether a completed hourly candle can reclaim the 0.7888 area, and whether OI falls alongside any pullback. If a completed hourly candle closes below 0.7066 (the low during the 09:00 hour), the short-term recovery structure would weaken. These are conditions to watch, not entry signals; this content is not a recommendation to chase the rally. The chart uses only completed candles; the unfinished 10:00–11:00 interval is not treated as a closing candle. Data timestamps are indicated separately in the text and chart.
During the 10:05 single-asset review, the 24-hour high had risen from 0.7850, recorded in the previous post, to 0.7888. The two most recent completed hourly candles both had relatively long upper wicks: from 08:00 to 09:00, the price closed at 0.7114 after starting at 0.7257; from 09:00 to 10:00, it opened at 0.7114, reached a high of 0.7888, and ultimately closed at 0.7294—about 7.53% below that hour’s high. After testing higher intrahour, the price retreated by the close; the new high should not be treated as a confirmed hold above that level.
Another change is open interest: Binance’s OI quantity sample rose from about 22.645 million tokens at 08:00 to about 24.980 million at 10:00, an increase of approximately 10.31%, while the price fell compared with the previous post. This indicates growing futures market participation, but does not distinguish between longs and shorts, nor does it prove net inflows or a short squeeze. How these position changes are absorbed over subsequent completed hourly candles matters more. The funding rate settled at 10:00 was -0.029786% (raw decimal -0.00029786), still negative, but the funding rate likewise cannot identify position direction.
No new announcement from the official iExec blog was found this round that coincided with the sharp rise on October 6, so the old roadmap is not being presented as a catalyst. Going forward, watch whether a completed hourly candle can reclaim the 0.7888 area, and whether OI falls alongside any pullback. If a completed hourly candle closes below 0.7066 (the low during the 09:00 hour), the short-term recovery structure would weaken. These are conditions to watch, not entry signals; this content is not a recommendation to chase the rally. The chart uses only completed candles; the unfinished 10:00–11:00 interval is not treated as a closing candle. Data timestamps are indicated separately in the text and chart.