Technical Analysis ($FLUID /USDT - Timeframe 1D)
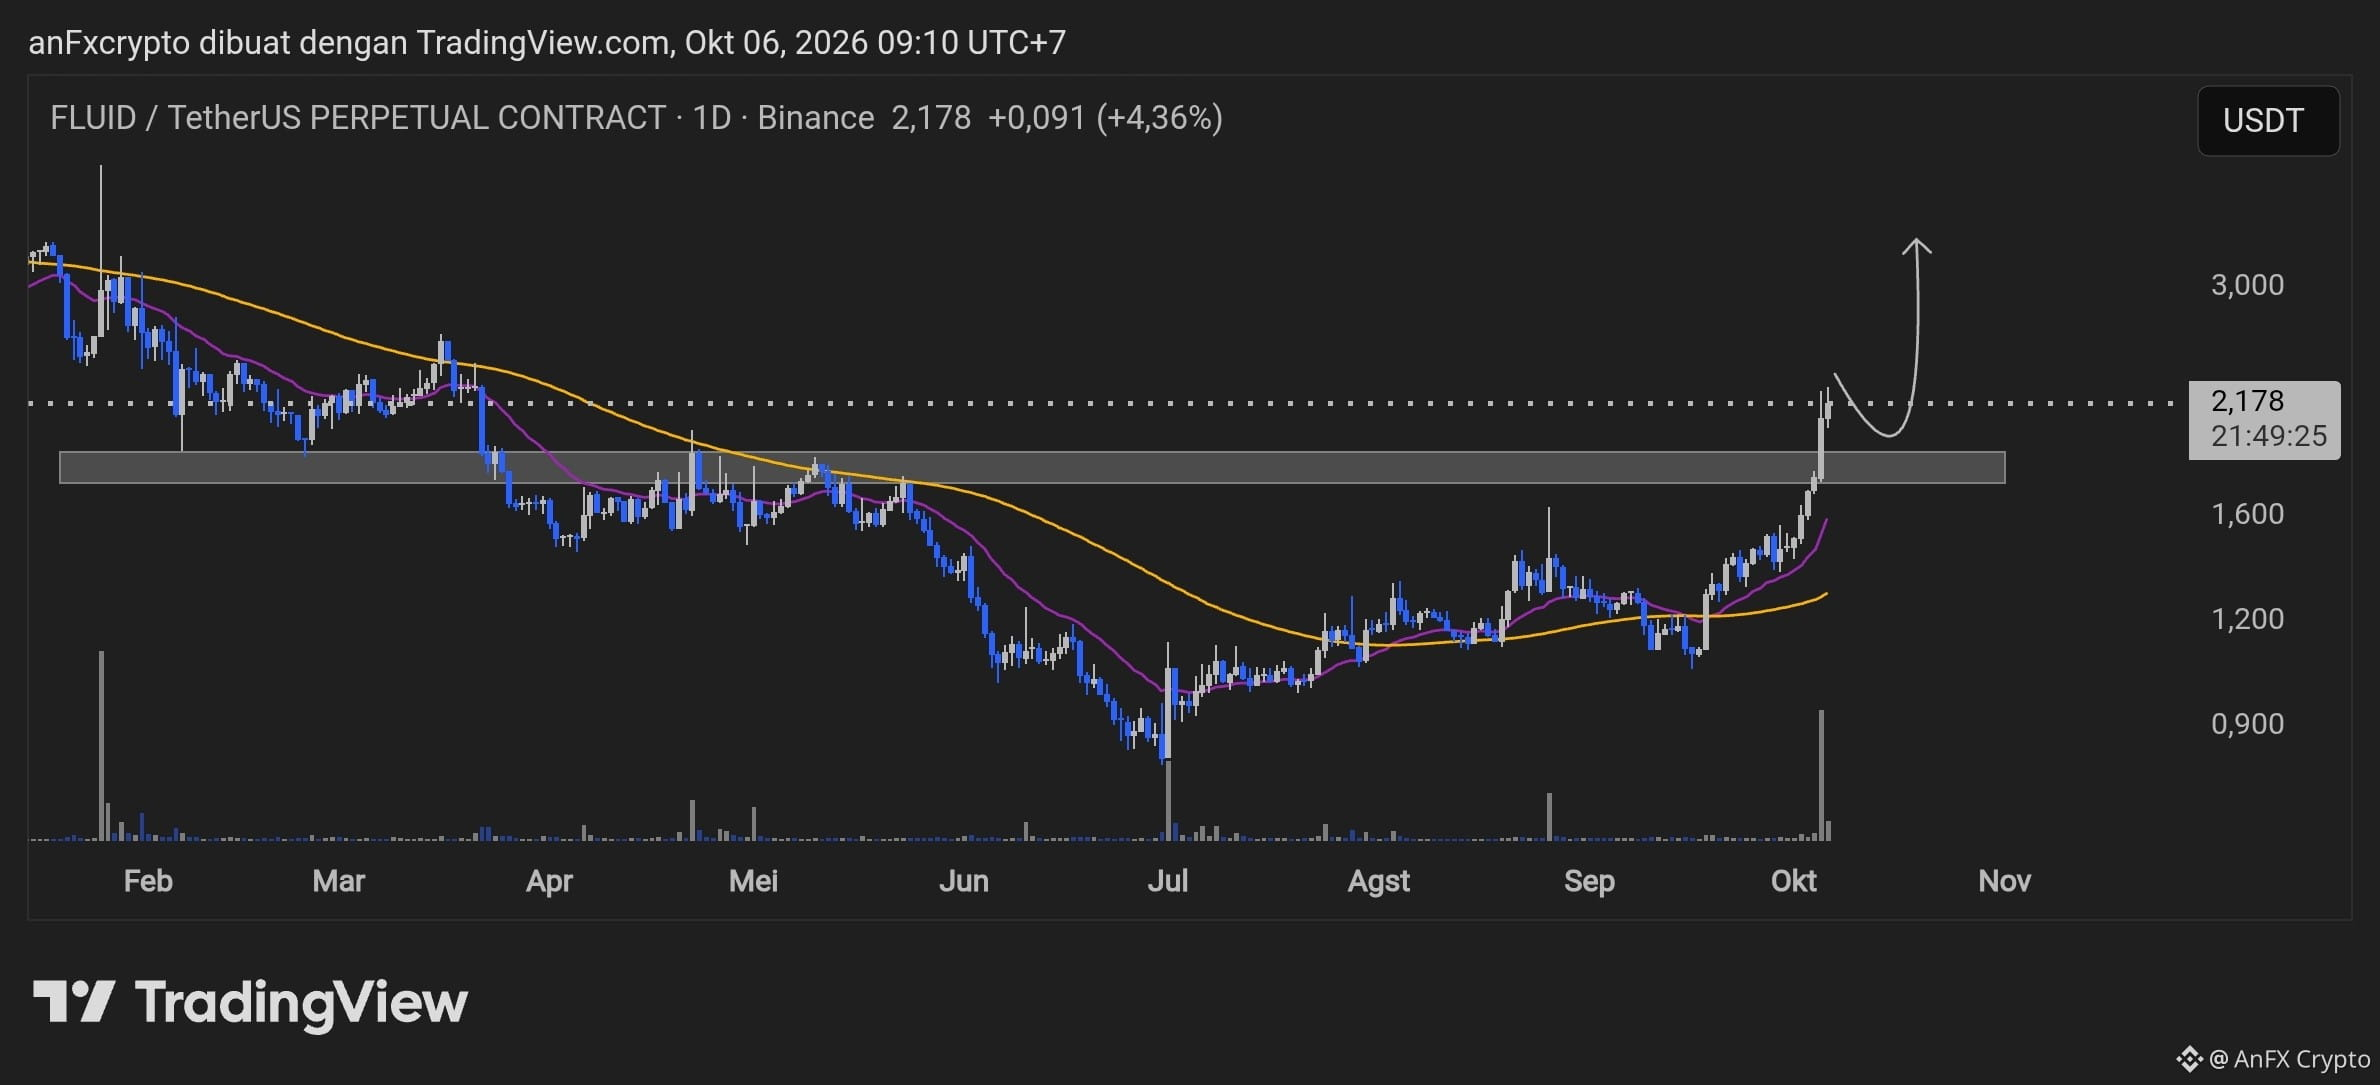
Trend Structure: Bullish reversal following a turn from the base accumulation area (bottoming phase) around 0.800–1.000 USDT.
Major Breakout: The price successfully broke through the key resistance zone at 1.700–1.850 USDT, marked by a surge in trading volume.
Movement Indicator: The Moving Average (MA) lines have formed a Golden Cross and are sloping upward, confirming strong bullish momentum.
Price Projection: The ideal scenario suggests a healthy correction (pullback/retest) to the new support zone (former resistance) before continuing upward toward the psychological target around 3.000 USDT.
Trading Signal Plan (Long / Buy on Dip)
Position: LONG (Spot / Futures)
Entry Area (Buy Limit): 1.850–2.050 USDT (wait for confirmation of a retest of the demand area)
Take Profit 1 (TP1): 2.500 USDT
Take Profit 2 (TP2): 3.000 USDT
Take Profit 3 (TP3): 3.300 USDT
Stop Loss (SL): 1.650 USDT (placed below the nearest support area)
Risk-to-Reward Ratio (RRR): ~1:3
Recommended Leverage: Maximum 2x–5x (Futures), or Spot Trading is recommended to minimize the risk of liquidation from short-term fluctuations.
Risk Management & Execution Strategy
Capital Allocation: Use a maximum of 3%–5% of your total trading portfolio for this position.
Avoid FOMO: Do not enter immediately at the current market price (2.178 USDT), as the position could be exposed to a short-term correction. Let the price approach the nearest entry area to achieve an optimal risk ratio.
Position Management: Move the Stop Loss to the Break-Even (BEP) level after TP1 is reached to secure your capital.
Trend Structure: Bullish reversal following a turn from the base accumulation area (bottoming phase) around 0.800–1.000 USDT.
Major Breakout: The price successfully broke through the key resistance zone at 1.700–1.850 USDT, marked by a surge in trading volume.
Movement Indicator: The Moving Average (MA) lines have formed a Golden Cross and are sloping upward, confirming strong bullish momentum.
Price Projection: The ideal scenario suggests a healthy correction (pullback/retest) to the new support zone (former resistance) before continuing upward toward the psychological target around 3.000 USDT.
Trading Signal Plan (Long / Buy on Dip)
Position: LONG (Spot / Futures)
Entry Area (Buy Limit): 1.850–2.050 USDT (wait for confirmation of a retest of the demand area)
Take Profit 1 (TP1): 2.500 USDT
Take Profit 2 (TP2): 3.000 USDT
Take Profit 3 (TP3): 3.300 USDT
Stop Loss (SL): 1.650 USDT (placed below the nearest support area)
Risk-to-Reward Ratio (RRR): ~1:3
Recommended Leverage: Maximum 2x–5x (Futures), or Spot Trading is recommended to minimize the risk of liquidation from short-term fluctuations.
Risk Management & Execution Strategy
Capital Allocation: Use a maximum of 3%–5% of your total trading portfolio for this position.
Avoid FOMO: Do not enter immediately at the current market price (2.178 USDT), as the position could be exposed to a short-term correction. Let the price approach the nearest entry area to achieve an optimal risk ratio.
Position Management: Move the Stop Loss to the Break-Even (BEP) level after TP1 is reached to secure your capital.