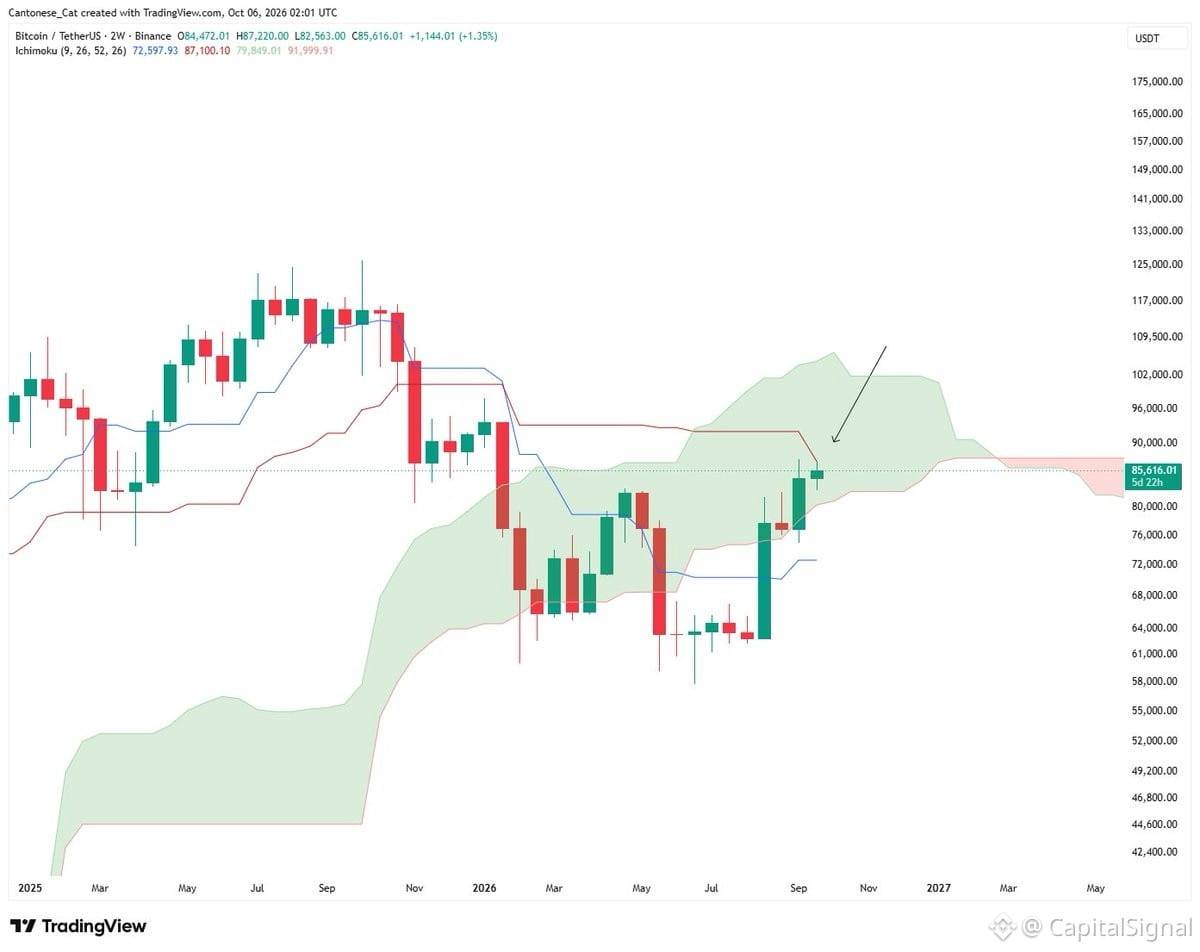
$BTC hitting another technical resistance—this time the 2-week Ichimoku Kijun line. Yeah, it's one of those TA levels that either matters or gets blown through in an hour.
Longer view: Bitcoin's clearly in stage 2 of its cycle. At some point it'll form a higher low, but timing that? Good luck. Could be tomorrow, could be months out, and the exact level is anyone's guess.
None of this changes the macro setup, but charts are fun to watch. Sometimes they give you an edge on entry timing, sometimes they just make you feel like you're doing something productive while the market does whatever it wants anyway.
If you're long-term bullish, this is noise. If you're trading the swings, keep an eye on whether this Kijun level actually holds or just becomes another tombstone for TA purists.
Longer view: Bitcoin's clearly in stage 2 of its cycle. At some point it'll form a higher low, but timing that? Good luck. Could be tomorrow, could be months out, and the exact level is anyone's guess.
None of this changes the macro setup, but charts are fun to watch. Sometimes they give you an edge on entry timing, sometimes they just make you feel like you're doing something productive while the market does whatever it wants anyway.
If you're long-term bullish, this is noise. If you're trading the swings, keep an eye on whether this Kijun level actually holds or just becomes another tombstone for TA purists.