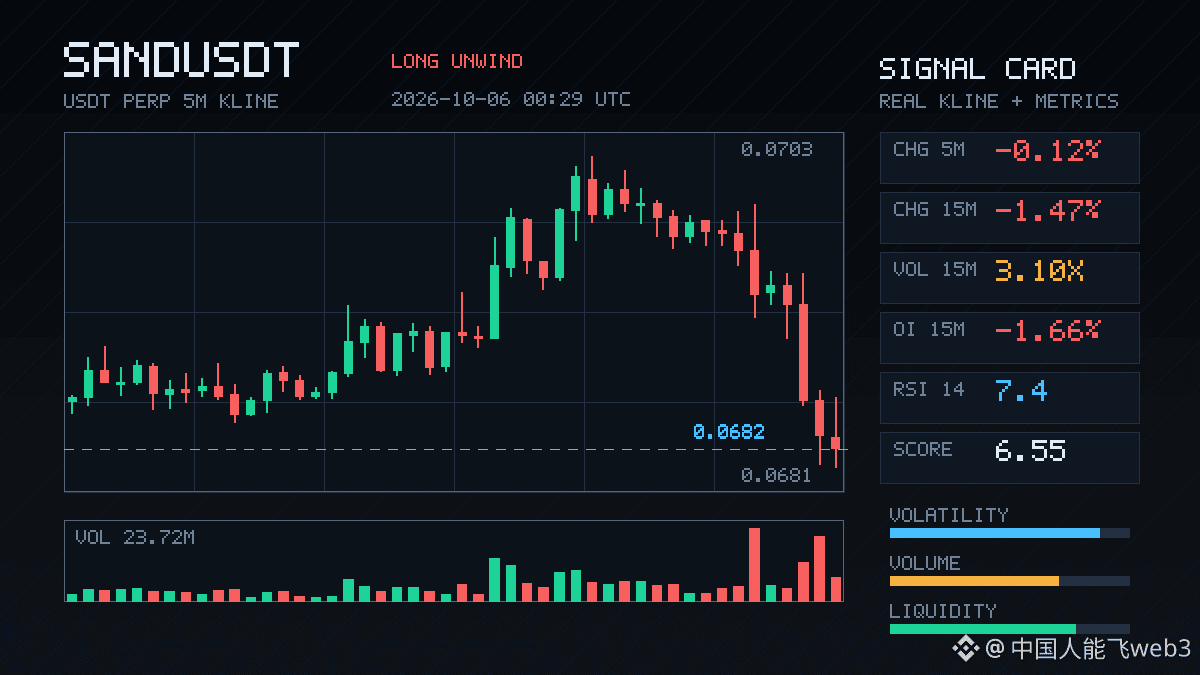
$SAND This drop is pretty sharp. The 15m chart printed a long red candle, and volume surged to more than 3x normal—clearly not ordinary position turnover.
More importantly, OI is falling along with it: down 1.66% in 15m and nearly 2% in 1h, with $1 million in notional value wiped out. Price down + OI down is a classic sign of longs exiting—either through stop-losses or by actively reducing positions—not the kind of setup you see when fresh shorts are opening and driving the price down.
The taker order flow delta is -28.4%, and the buy/sell ratio is 0.56, so selling pressure is in control. The OI anomaly percentile has hit 93.8%, ranking #4 across the entire pool, and the move has persisted for several consecutive periods. The confirmation is solid.
24h trading volume is still over $200 million, so liquidity isn't bad. But when long deleveraging accelerates at a level like this, it can trigger a chain reaction. Let's see whether this wave of leverage has fully flushed out.
More importantly, OI is falling along with it: down 1.66% in 15m and nearly 2% in 1h, with $1 million in notional value wiped out. Price down + OI down is a classic sign of longs exiting—either through stop-losses or by actively reducing positions—not the kind of setup you see when fresh shorts are opening and driving the price down.
The taker order flow delta is -28.4%, and the buy/sell ratio is 0.56, so selling pressure is in control. The OI anomaly percentile has hit 93.8%, ranking #4 across the entire pool, and the move has persisted for several consecutive periods. The confirmation is solid.
24h trading volume is still over $200 million, so liquidity isn't bad. But when long deleveraging accelerates at a level like this, it can trigger a chain reaction. Let's see whether this wave of leverage has fully flushed out.