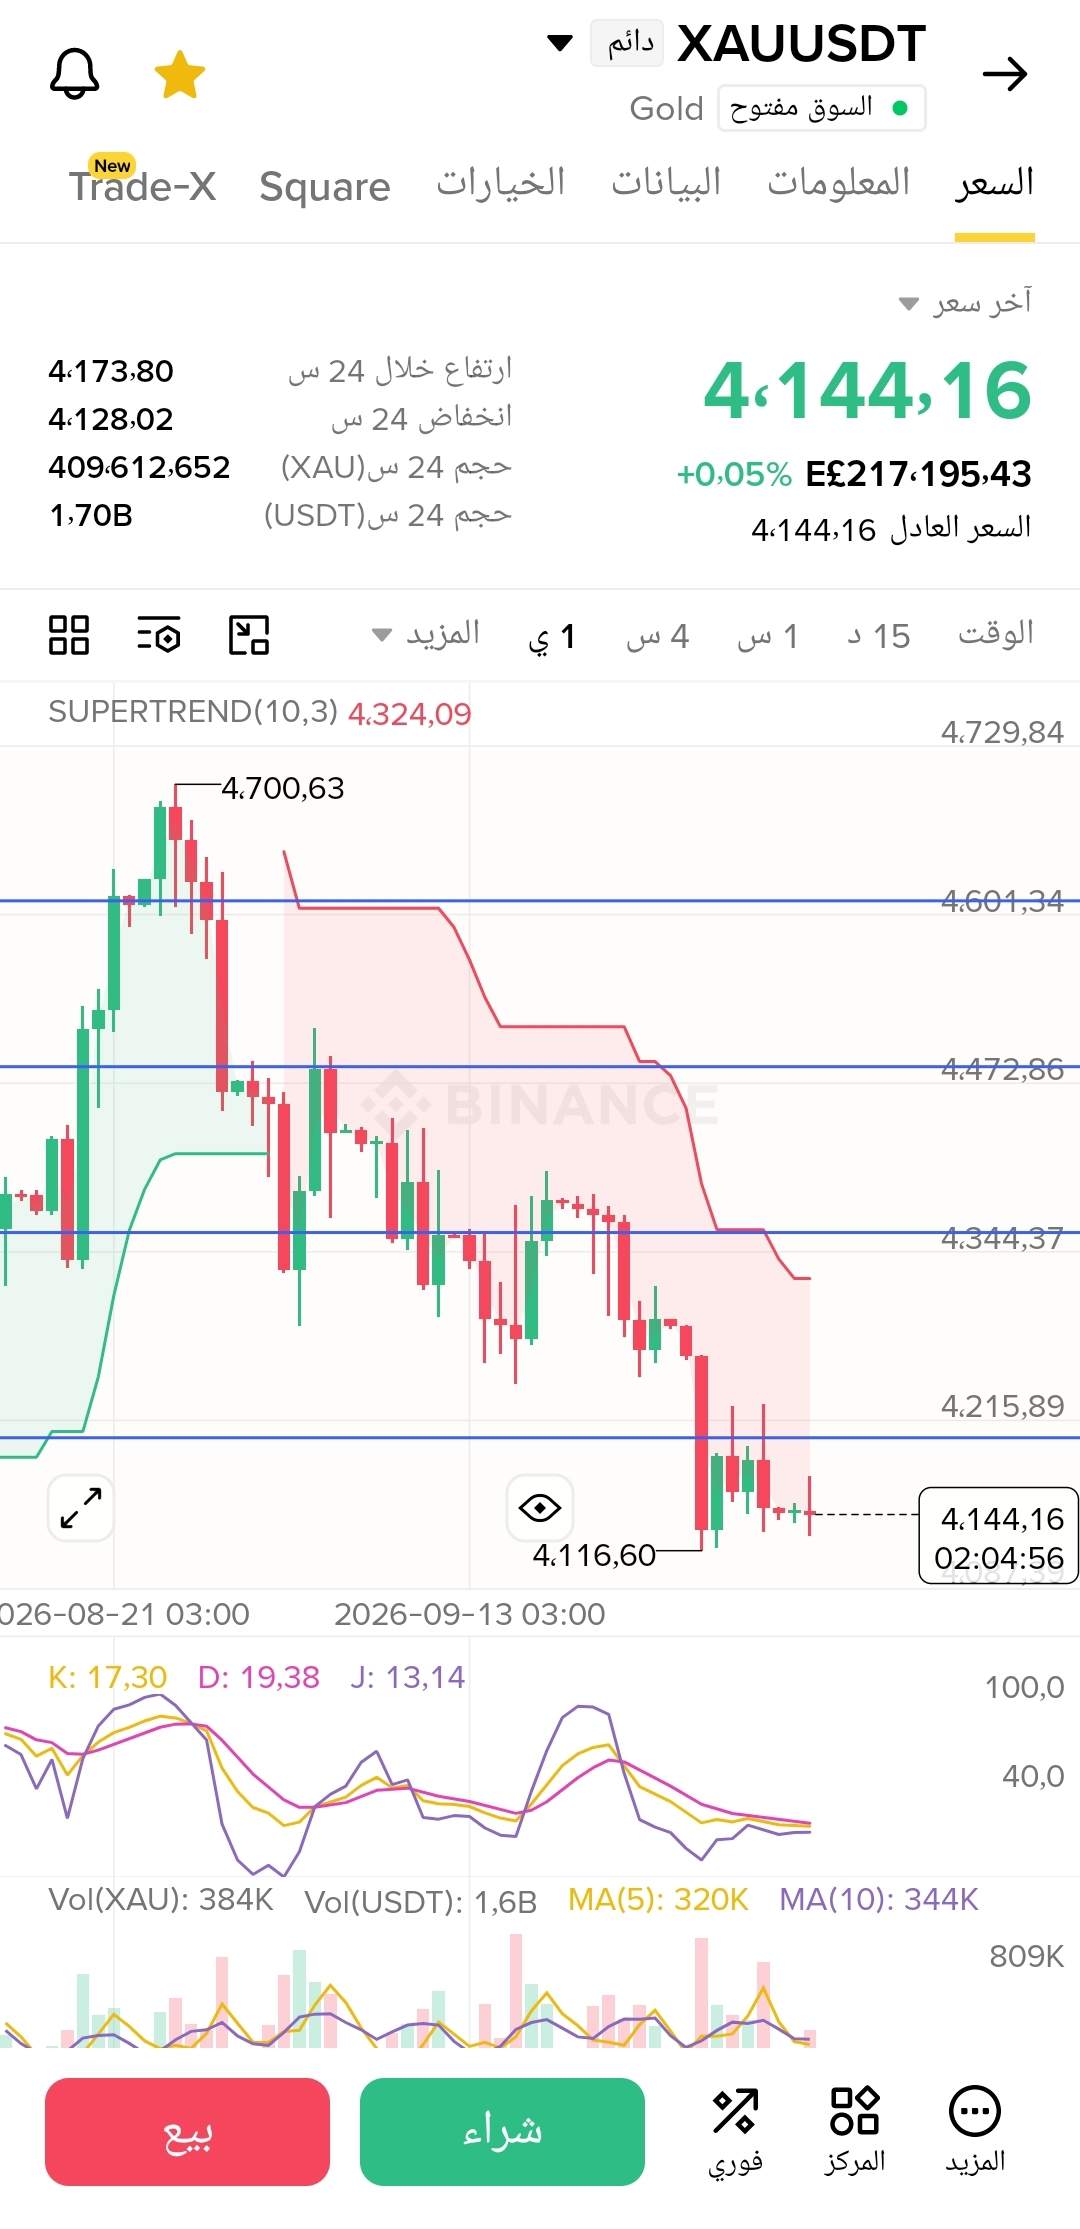

Hello to all our followers in the Binance Square community! 👋 Let’s take a quick technical look at gold’s daily price action based on the data shown on the chart.
* Current price: Gold is trading at $4,144.16, holding steady with a slight gain of +0.05%.
* Overall trend (Supertrend): The Supertrend indicator (10,3) at 4,324.09 continues to reflect dominant downward pressure in the medium term, with the price moving within the bearish red zone.
* Support and resistance levels:
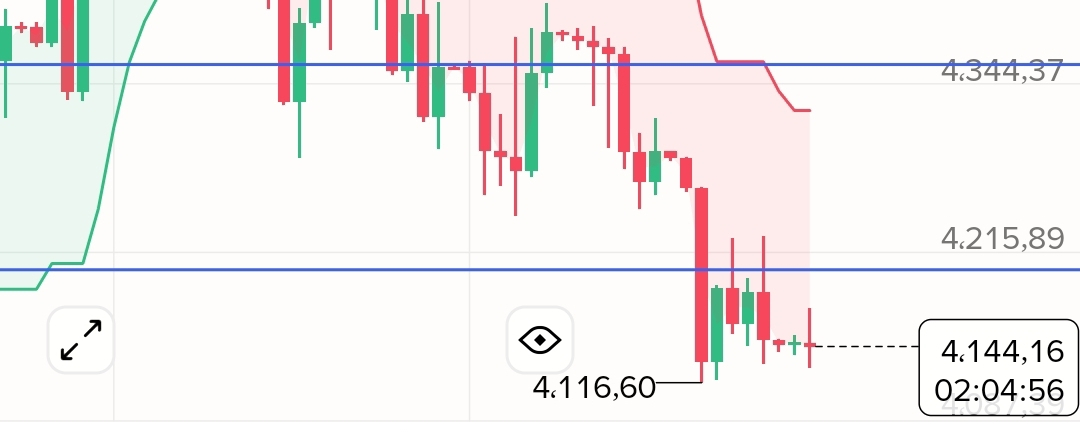
- Current support: The price is testing zones near the recent low of $4,116.60, an important support level that should be monitored carefully
- Nearby resistance: The first resistance is at $4,215.89, followed by stronger resistance at $4,344.37 and $4,472.86
* Momentum indicators (KDJ): The indicator lines are converging at low levels (K: 17.30, D: 19.38, J: 13.14), suggesting the price has entered oversold territory, which may pave the way for a corrective rebound or near-term sideways movement.
📌 Technical outlook summary:
The price is in a downward trend on the daily timeframe and is nearing a test of critical support zones around $4,116. Please exercise caution, manage your capital wisely, and wait for clear reversal signals or a breakout above nearby resistance before making any investment decisions.
Share your opinion in the comments: Do you expect gold to rebound from these levels or continue falling? 👇
#ETHUp70%InQ3ButLiquidityFalls
#EthStakingExitQueueHits2026High
#Nikkei225Jumps2.5%ToThreeMonthHigh