$HYPE 🚀 $HYPE /USDT | Breakout and Bullish Momentum!
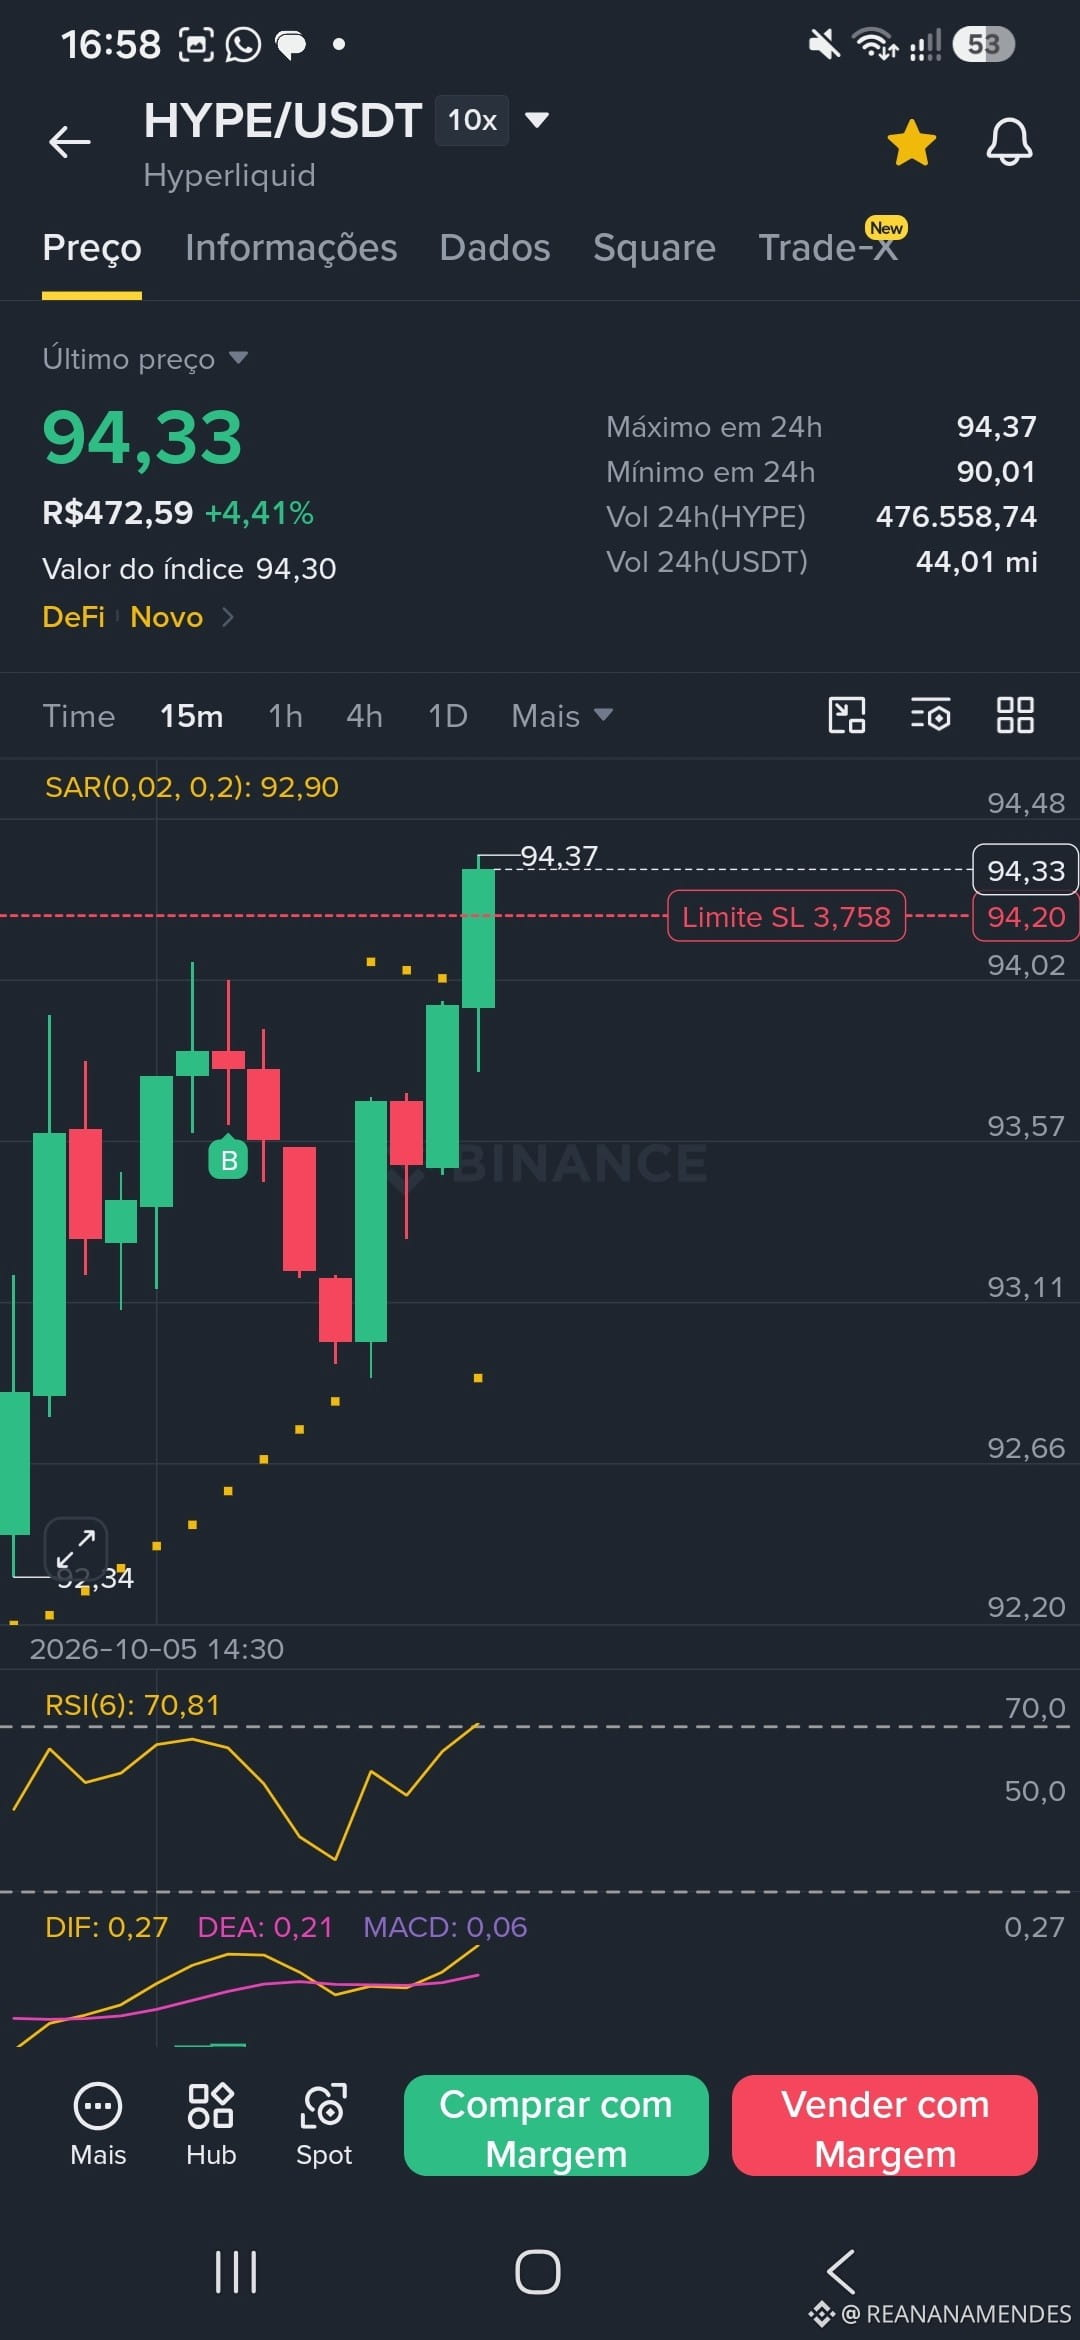
The 15m chart for HYPE/USDT shows a strong bullish structure, trading at 94.33 USDT (+4.41%):
Trend: Strong green candles are pushing the daily high to 94.37 USDT.
Parabolic SAR: Dots below the candles confirm buying pressure.
Indicators: RSI at 70.81 (overbought/strength zone) and MACD with a bullish crossover triggered.
⚠️️ Risk Management: Keep an eye on resistance at the recent high and protect your positions by adjusting your Stop Loss.
What’s your outlook for HYPE over the next few hours? Leave a comment! 👇
#BinanceSquare #CryptoTrading #HYPE #TechnicalAnalysis
The 15m chart for HYPE/USDT shows a strong bullish structure, trading at 94.33 USDT (+4.41%):
Trend: Strong green candles are pushing the daily high to 94.37 USDT.
Parabolic SAR: Dots below the candles confirm buying pressure.
Indicators: RSI at 70.81 (overbought/strength zone) and MACD with a bullish crossover triggered.
⚠️️ Risk Management: Keep an eye on resistance at the recent high and protect your positions by adjusting your Stop Loss.
What’s your outlook for HYPE over the next few hours? Leave a comment! 👇
#BinanceSquare #CryptoTrading #HYPE #TechnicalAnalysis