📚 LET’S LEARN TOGETHER🧠🤓: What does the "Monday Open" teach us about liquidity in $BTC ?
When traditional markets open on Mondays, the crypto market experiences sudden spikes in volume. Market makers take advantage of these early hours to seek out liquidity accumulated over the weekend, sweeping up Stop Loss orders placed above or below the consolidation ranges.
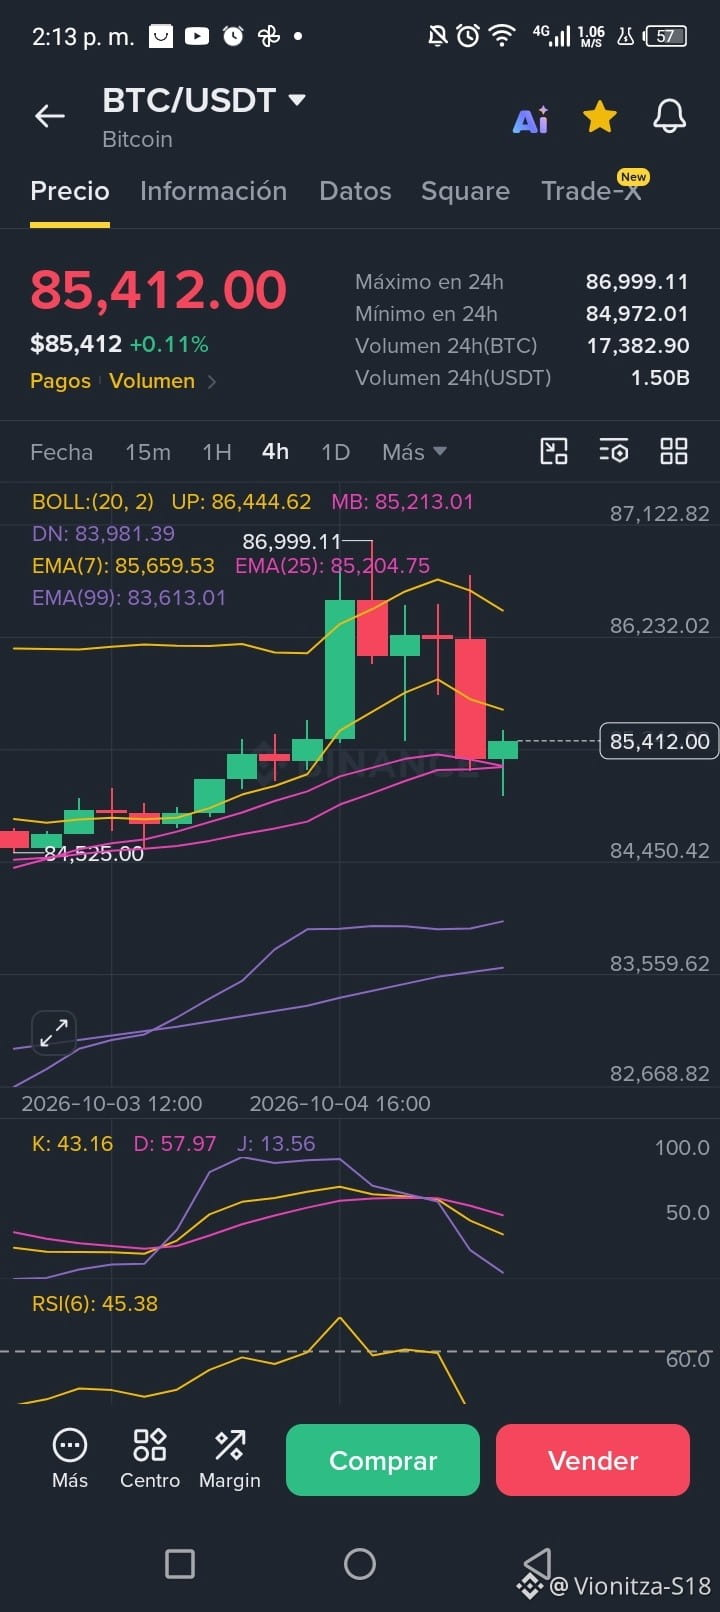
On the 4-hour Bitcoin chart ($BTC ), we can see this move in action. The price is trading at $85,412.00 (+0.11%) after a rejection candle from the high of $86,999.11, as it looks for dynamic support.
🧠🤓TODAY’S LESSON is to observe how the price held perfectly above the EMA 25 floor ($85,204.75) and the Bollinger midline ($85,213.01). Meanwhile, the EMA 7 ($85,659.53) is acting as the first immediate resistance to break. With the RSI cooled off at 45.38 points in neutral territory, the market shows that the initial liquidity sweep has already happened and is now looking to establish a base.
⚡ Monitor liquidity sweeps in real time!
👇 Tap the buttons on the interactive card for $BTC below. Open the real-time chart, check the order book, and position your strategy in 1 click.
👉 Save this post to review this early-week pattern and follow me on Binance Square.
💬 Do you still have questions about how to find liquidity zones? Leave them in the comments below and tell me what other concept you’d like to learn!
When traditional markets open on Mondays, the crypto market experiences sudden spikes in volume. Market makers take advantage of these early hours to seek out liquidity accumulated over the weekend, sweeping up Stop Loss orders placed above or below the consolidation ranges.
On the 4-hour Bitcoin chart ($BTC ), we can see this move in action. The price is trading at $85,412.00 (+0.11%) after a rejection candle from the high of $86,999.11, as it looks for dynamic support.
🧠🤓TODAY’S LESSON is to observe how the price held perfectly above the EMA 25 floor ($85,204.75) and the Bollinger midline ($85,213.01). Meanwhile, the EMA 7 ($85,659.53) is acting as the first immediate resistance to break. With the RSI cooled off at 45.38 points in neutral territory, the market shows that the initial liquidity sweep has already happened and is now looking to establish a base.
⚡ Monitor liquidity sweeps in real time!
👇 Tap the buttons on the interactive card for $BTC below. Open the real-time chart, check the order book, and position your strategy in 1 click.
👉 Save this post to review this early-week pattern and follow me on Binance Square.
💬 Do you still have questions about how to find liquidity zones? Leave them in the comments below and tell me what other concept you’d like to learn!