$ETH Crypto-Circle Academician: Is Ethereum (ETH) consolidation on October 6 masking the underlying trend? Latest market analysis
Ethereum is currently at 2680. Many people watching Ethereum over the National Day holiday feel that the market is testing their patience. After a sharp rise, it has entered a prolonged period of consolidation, with prices swinging back and forth on the candlestick chart. Going long risks a pullback after a surge, while going short risks being caught out by a sudden strong bullish candle breaking through resistance. ETH is currently at 2690. The broader bullish trend is still intact, but short-term upward momentum has clearly slowed, and the tug-of-war between buyers and sellers has reached an impasse.
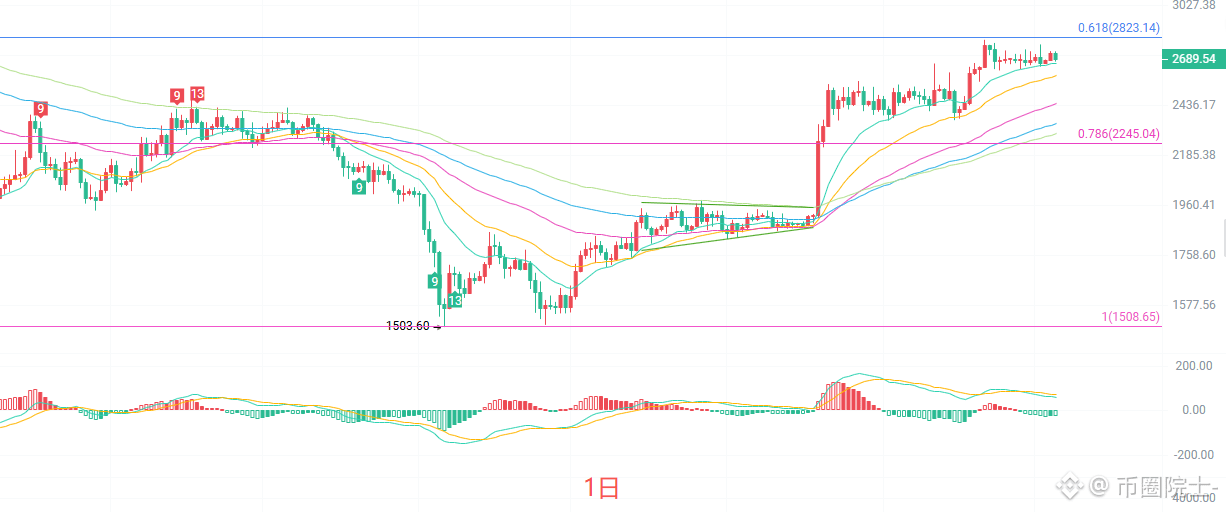
On the daily chart, EMA15 is around 2670, while EMA30 and EMA60 continue to trend upward. The medium- and long-term moving averages remain in a bullish alignment, and the broader trend has not reversed. The Bollinger Bands are narrowing, with price above the middle band. The MACD histogram's red bars are shrinking, while DIF and DEA remain above the zero line, so the broader bullish foundation remains in place. The key resistance above is near 2802, the previous high; support below is at 2445, the 0.786 Fibonacci level. The daily chart is currently in a high-level consolidation phase following the rise, awaiting a directional move. There is no clear short-term one-way signal yet.
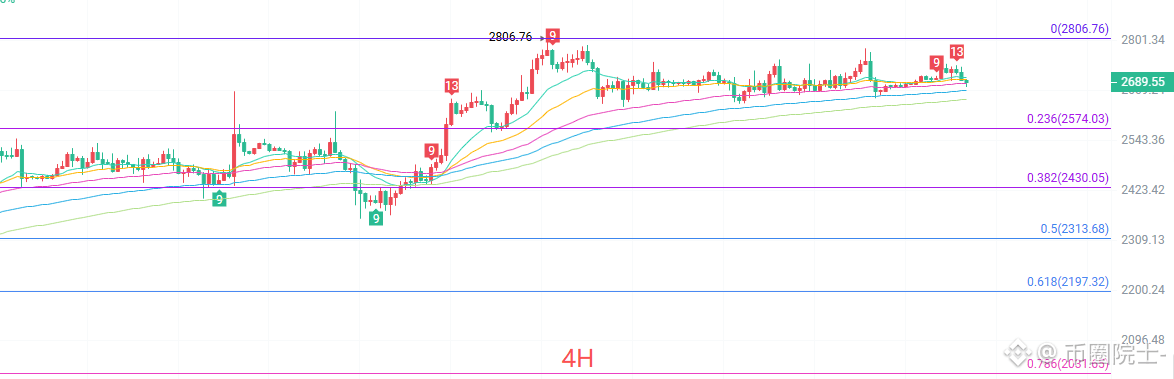
On the four-hour chart, EMA15, EMA30, and EMA60 are tightly converged, with price moving close to the group of moving averages—a typical consolidation pattern. The Bollinger Band width continues to narrow, with the upper and lower bands compressing into the 2661–2727 range, limiting the scope for price movement. The MACD's DIF has crossed below DEA, indicating that short-term bullish momentum is fading. The 0.236 Fibonacci level at 2574 is strong support, while 2806 above is resistance at the recent high. The four-hour chart is building momentum, and a breakout from the range is likely. Until a breakout occurs, a consolidation-based approach takes priority.
Short-term levels to watch:
Long: If price holds around 2670–2630, stop-loss 40 points below; targets 2730–2800.
Short: If price stalls around 2790–2810, stop-loss 40 points above; targets 2720–2660.
For specific trades, rely primarily on real-time order-book data. For more information, you can contact the author. This article may be published with a delay and is for reference only. You are responsible for your own risk.
#ETH走势分析
Ethereum is currently at 2680. Many people watching Ethereum over the National Day holiday feel that the market is testing their patience. After a sharp rise, it has entered a prolonged period of consolidation, with prices swinging back and forth on the candlestick chart. Going long risks a pullback after a surge, while going short risks being caught out by a sudden strong bullish candle breaking through resistance. ETH is currently at 2690. The broader bullish trend is still intact, but short-term upward momentum has clearly slowed, and the tug-of-war between buyers and sellers has reached an impasse.
On the daily chart, EMA15 is around 2670, while EMA30 and EMA60 continue to trend upward. The medium- and long-term moving averages remain in a bullish alignment, and the broader trend has not reversed. The Bollinger Bands are narrowing, with price above the middle band. The MACD histogram's red bars are shrinking, while DIF and DEA remain above the zero line, so the broader bullish foundation remains in place. The key resistance above is near 2802, the previous high; support below is at 2445, the 0.786 Fibonacci level. The daily chart is currently in a high-level consolidation phase following the rise, awaiting a directional move. There is no clear short-term one-way signal yet.
On the four-hour chart, EMA15, EMA30, and EMA60 are tightly converged, with price moving close to the group of moving averages—a typical consolidation pattern. The Bollinger Band width continues to narrow, with the upper and lower bands compressing into the 2661–2727 range, limiting the scope for price movement. The MACD's DIF has crossed below DEA, indicating that short-term bullish momentum is fading. The 0.236 Fibonacci level at 2574 is strong support, while 2806 above is resistance at the recent high. The four-hour chart is building momentum, and a breakout from the range is likely. Until a breakout occurs, a consolidation-based approach takes priority.
Short-term levels to watch:
Long: If price holds around 2670–2630, stop-loss 40 points below; targets 2730–2800.
Short: If price stalls around 2790–2810, stop-loss 40 points above; targets 2720–2660.
For specific trades, rely primarily on real-time order-book data. For more information, you can contact the author. This article may be published with a delay and is for reference only. You are responsible for your own risk.
#ETH走势分析