📊 $ZEC — 15M TECHNICAL ANALYSIS
🔥 VJ ANALYSIS | Intraday VIP Setup
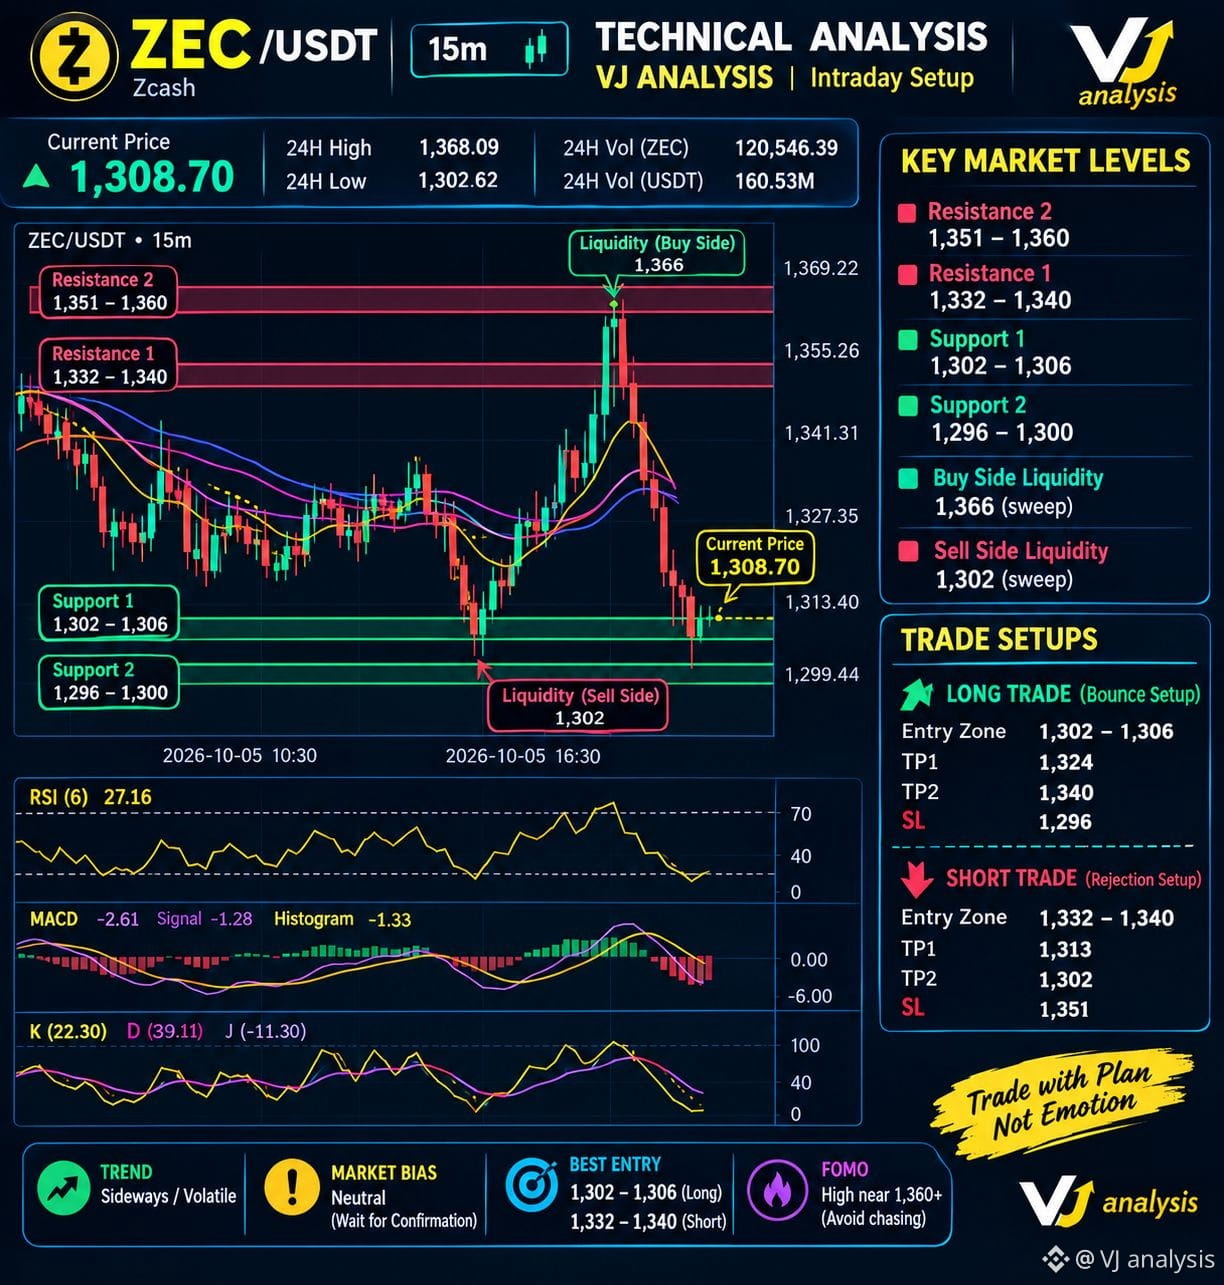
ZEC is currently trading around 1,308.70, following a sharp rejection from the 1,366 liquidity zone. The 15M chart shows strong selling pressure, with price now testing the lower support area. Momentum indicators are also weak, suggesting volatility can remain high.
🟢 KEY SUPPORT LEVELS
• Support 1: 1,302–1,306
• Support 2: 1,296–1,300
• Sell-side liquidity: around 1,302
🔴 KEY RESISTANCE LEVELS
• Resistance 1: 1,332–1,340
• Resistance 2: 1,351–1,360
• Buy-side liquidity: around 1,366
🚀 LONG SETUP — BOUNCE TRADE #zec
Watch 1,302–1,306 for a confirmed bullish reaction.
🎯 TP1: 1,324
🎯 TP2: 1,340
🛑 SL: 1,296
If price sweeps below 1,302 and quickly reclaims the zone, a long setup becomes stronger.
🔻 SHORT SETUP — REJECTION TRADE #zecusdt
If ZEC rebounds toward 1,332–1,340 and gets rejected, sellers may regain control.
🎯 TP1: 1,313
🎯 TP2: 1,302
🛑 SL: 1,351
⚠️ FOMO ALERT: The previous spike toward 1,366 has already captured buy-side liquidity. Avoid chasing random pumps. Wait for confirmation at the marked zones.
📌 Market Bias: Neutral / volatile
📌 Best Long: 1,302–1,306
📌 Best Short: 1,332–1,340
Trade the setup, not the emotion. Always manage risk and wait for confirmation before entering.
🔥 VJ ANALYSIS — PLAN YOUR TRADE.$ZEC
🔥 VJ ANALYSIS | Intraday VIP Setup
ZEC is currently trading around 1,308.70, following a sharp rejection from the 1,366 liquidity zone. The 15M chart shows strong selling pressure, with price now testing the lower support area. Momentum indicators are also weak, suggesting volatility can remain high.
🟢 KEY SUPPORT LEVELS
• Support 1: 1,302–1,306
• Support 2: 1,296–1,300
• Sell-side liquidity: around 1,302
🔴 KEY RESISTANCE LEVELS
• Resistance 1: 1,332–1,340
• Resistance 2: 1,351–1,360
• Buy-side liquidity: around 1,366
🚀 LONG SETUP — BOUNCE TRADE #zec
Watch 1,302–1,306 for a confirmed bullish reaction.
🎯 TP1: 1,324
🎯 TP2: 1,340
🛑 SL: 1,296
If price sweeps below 1,302 and quickly reclaims the zone, a long setup becomes stronger.
🔻 SHORT SETUP — REJECTION TRADE #zecusdt
If ZEC rebounds toward 1,332–1,340 and gets rejected, sellers may regain control.
🎯 TP1: 1,313
🎯 TP2: 1,302
🛑 SL: 1,351
⚠️ FOMO ALERT: The previous spike toward 1,366 has already captured buy-side liquidity. Avoid chasing random pumps. Wait for confirmation at the marked zones.
📌 Market Bias: Neutral / volatile
📌 Best Long: 1,302–1,306
📌 Best Short: 1,332–1,340
Trade the setup, not the emotion. Always manage risk and wait for confirmation before entering.
🔥 VJ ANALYSIS — PLAN YOUR TRADE.$ZEC