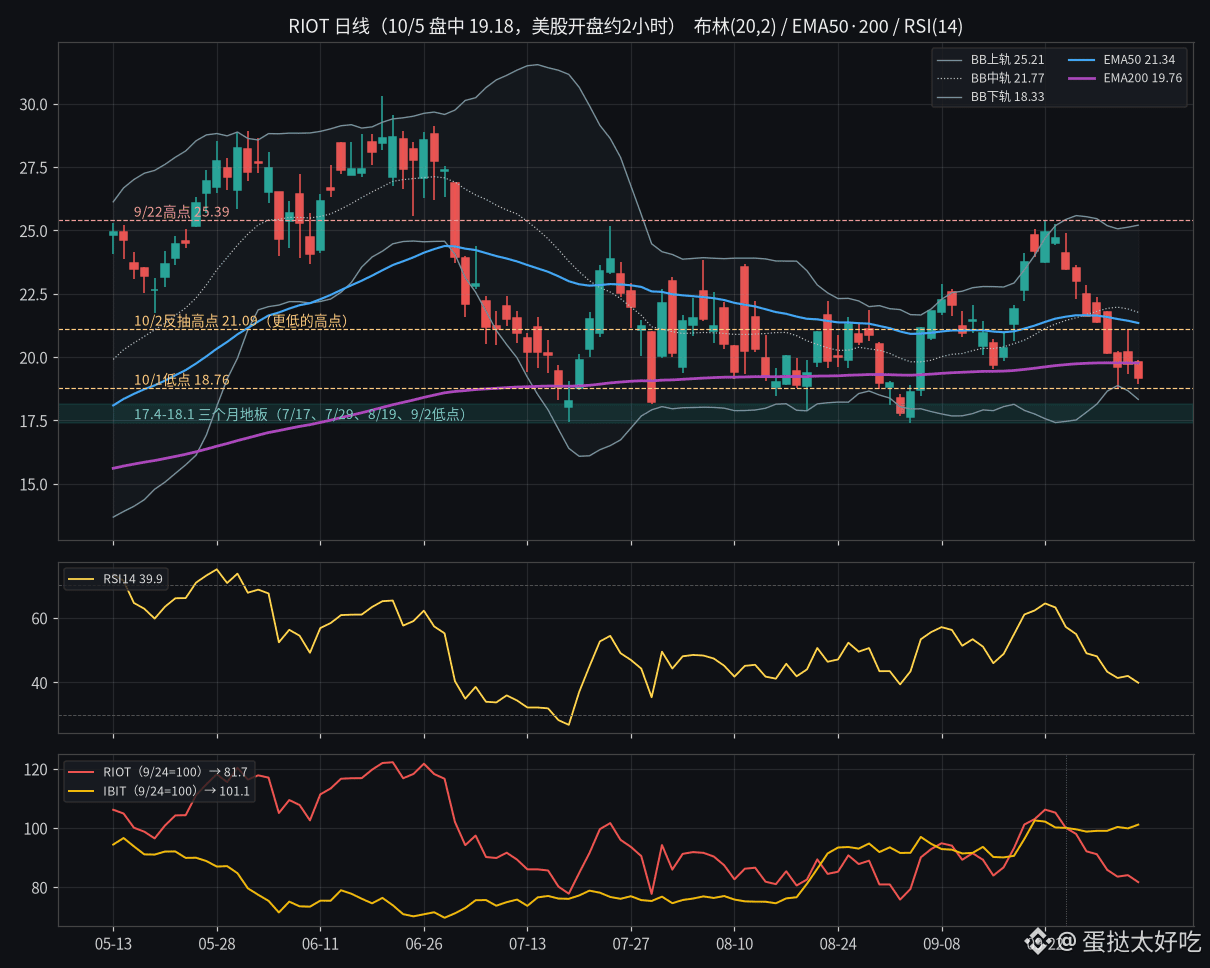
Bitcoin is only 2.3% below its 20-day high, yet $RIOT fell back below its 200-day moving average tonight. Plenty of people are waiting for mining stocks to catch up. I see it differently: whether it breaks this line isn’t the point—the point is that it’s stopped moving with Bitcoin.
A little over two hours into the session, RIOT was at 19.18, down 2.8%; $MARA 10.95, down 2.5%; and the spot Bitcoin ETF IBIT was up 1.3%. Since 9/24, IBIT is up 1.1%, while RIOT is down 18.3%.
The daily EMA200 is at 19.76, and RIOT has closed below it for a third consecutive day since 10/1. The EMA12/26/50 are at 21.04/21.26/21.34, all overhead. But the EMA200 is still turning upward. Over the past three months, RIOT has closed below it on 10 days, and quickly reclaimed it on 7/17, 7/29, and 9/2. This line alone doesn’t tell us much.
The Bollinger Bands (20,2) have a middle band at 21.77 and a lower band at 18.33. %B is 0.12, hugging the lower band, while bandwidth has widened from 28.2% to 31.6%—the bands are opening downward. RSI(14) is 39.9, not yet oversold. But when the stock found a bottom on 8/14 and 9/1, RSI was only 41 and 39, respectively. RSI isn’t much help here; we need to watch the price levels.
Structurally, since the 9/22 high of 25.39, the lows have stepped down to 21.57, 20.11, and 18.76. The 10/2 rebound to 21.09 was a lower high. The real floor is at 17.4–18.1, where the stock found support four times from July to early September. The lower band is right around the top of that range. Volume was 3.92 million shares, just a quarter of the 20-day average—not a sharp sell-off, and no panic selling.
I’m leaning toward a retest of the 17.4–18.1 floor first. If the daily close gets back above 21.34 (EMA50), then I’m wrong.
Whether mining stocks still count as leveraged plays on Bitcoin: the answer over the past two weeks is no. If you’re holding one and waiting for Bitcoin to lift it, first be clear about what you bought—is it Bitcoin, or electricity costs and computing power?
#美股 #比特币矿企 #TechnicalAnalysis
A little over two hours into the session, RIOT was at 19.18, down 2.8%; $MARA 10.95, down 2.5%; and the spot Bitcoin ETF IBIT was up 1.3%. Since 9/24, IBIT is up 1.1%, while RIOT is down 18.3%.
The daily EMA200 is at 19.76, and RIOT has closed below it for a third consecutive day since 10/1. The EMA12/26/50 are at 21.04/21.26/21.34, all overhead. But the EMA200 is still turning upward. Over the past three months, RIOT has closed below it on 10 days, and quickly reclaimed it on 7/17, 7/29, and 9/2. This line alone doesn’t tell us much.
The Bollinger Bands (20,2) have a middle band at 21.77 and a lower band at 18.33. %B is 0.12, hugging the lower band, while bandwidth has widened from 28.2% to 31.6%—the bands are opening downward. RSI(14) is 39.9, not yet oversold. But when the stock found a bottom on 8/14 and 9/1, RSI was only 41 and 39, respectively. RSI isn’t much help here; we need to watch the price levels.
Structurally, since the 9/22 high of 25.39, the lows have stepped down to 21.57, 20.11, and 18.76. The 10/2 rebound to 21.09 was a lower high. The real floor is at 17.4–18.1, where the stock found support four times from July to early September. The lower band is right around the top of that range. Volume was 3.92 million shares, just a quarter of the 20-day average—not a sharp sell-off, and no panic selling.
I’m leaning toward a retest of the 17.4–18.1 floor first. If the daily close gets back above 21.34 (EMA50), then I’m wrong.
Whether mining stocks still count as leveraged plays on Bitcoin: the answer over the past two weeks is no. If you’re holding one and waiting for Bitcoin to lift it, first be clear about what you bought—is it Bitcoin, or electricity costs and computing power?
#美股 #比特币矿企 #TechnicalAnalysis