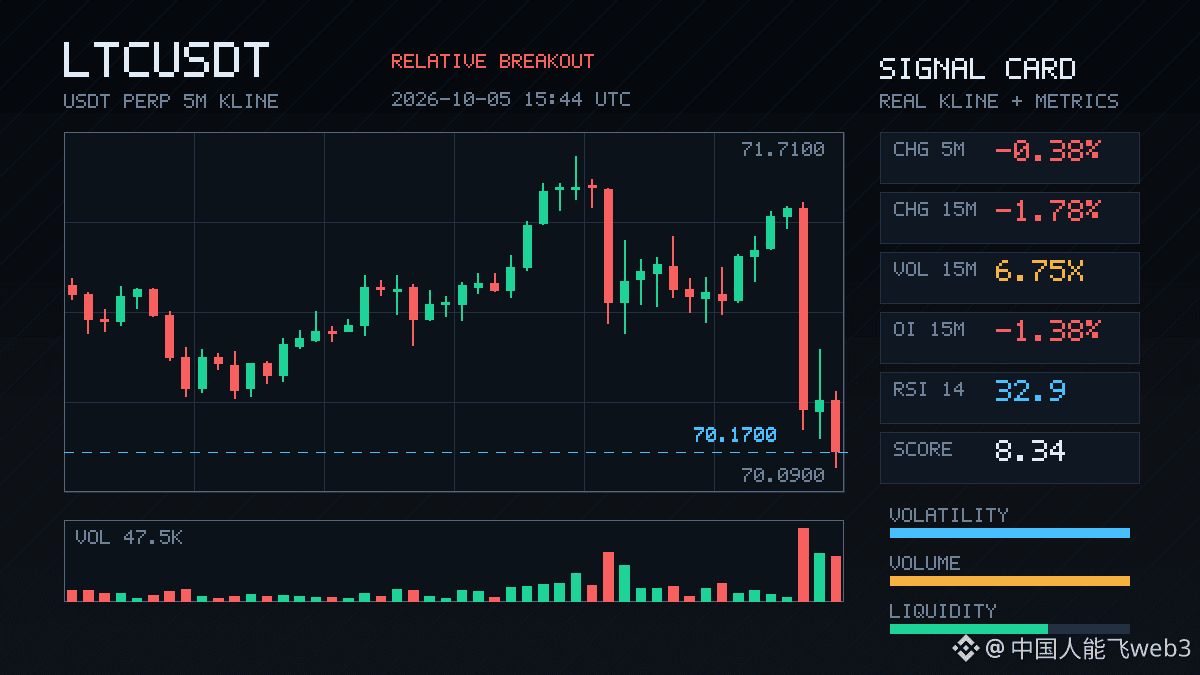
$LTC These past 15 minutes haven't looked good.
A single 15m candle plunged 1.78%, with volume hitting 6.75 times normal and a Z-score of 5.08. This isn't ordinary volatility—someone is getting out with serious money on the line. The closing price fell below the lower bound of the last 20 5m candles. Aggressive trade flow was -24.4%, and the buy/sell ratio was 0.61, showing clear selling pressure.
The key is OI. 15m futures: -1.38%, notional -3.12M; 1h futures: -1.26%, notional -2.53M. Price down + OI down is a classic case of longs deleveraging—not new shorts piling in to drive the price down, but existing longs hitting stop-losses or actively cutting positions because they can't hold on. The OI anomaly percentile hit 100%, ranking #2 across the entire pool for anomalies and #5 for notional change. Data moves of this magnitude suggest it's not just the LTC pool that's active, but LTC is indeed in an extreme zone.
The move has persisted across multiple consecutive timeframes, and order-book depth confirms it too. 24h trading volume is 94.25M—not particularly large, but combined with this volume multiple, short-term sentiment has reached a critical point.
The question now is: has this deleveraging wave run its course? OI is still falling, which means positions are still being liquidated. Don't rush to buy the dip. Wait for OI to stabilize and volume to subside before reassessing.
A single 15m candle plunged 1.78%, with volume hitting 6.75 times normal and a Z-score of 5.08. This isn't ordinary volatility—someone is getting out with serious money on the line. The closing price fell below the lower bound of the last 20 5m candles. Aggressive trade flow was -24.4%, and the buy/sell ratio was 0.61, showing clear selling pressure.
The key is OI. 15m futures: -1.38%, notional -3.12M; 1h futures: -1.26%, notional -2.53M. Price down + OI down is a classic case of longs deleveraging—not new shorts piling in to drive the price down, but existing longs hitting stop-losses or actively cutting positions because they can't hold on. The OI anomaly percentile hit 100%, ranking #2 across the entire pool for anomalies and #5 for notional change. Data moves of this magnitude suggest it's not just the LTC pool that's active, but LTC is indeed in an extreme zone.
The move has persisted across multiple consecutive timeframes, and order-book depth confirms it too. 24h trading volume is 94.25M—not particularly large, but combined with this volume multiple, short-term sentiment has reached a critical point.
The question now is: has this deleveraging wave run its course? OI is still falling, which means positions are still being liquidated. Don't rush to buy the dip. Wait for OI to stabilize and volume to subside before reassessing.