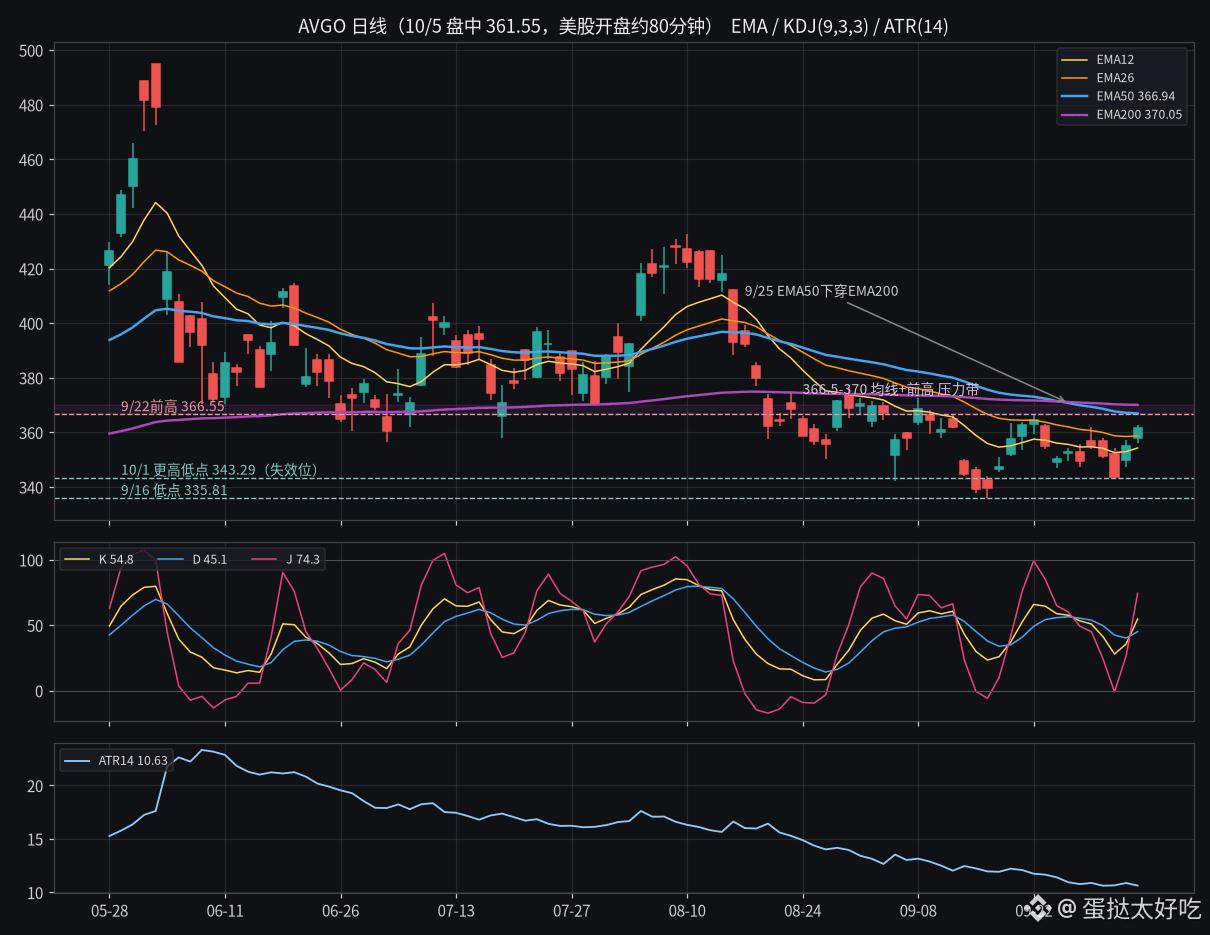
Broadcom’s daily EMA50 has been below its EMA200 for seven trading days now. By the textbook, you should stay away. I actually think this is where the bears are most uncomfortable.
About 80 minutes after the U.S. market opened, $AVGO 361.55 was up 1.8% from Friday’s close of 355.14, with an intraday high of 362.60. At the same time, $NVDA was up 1.3%, QQQ was up 0.5%, and the 10-year Treasury yield was 5.31%. Volume was 5.18 million shares, about one-fifth of the 20-day average of 25.04 million—not exactly a surge in buying, even accounting for the time of day.
First, the death cross. When the EMA50 fell below the EMA200 on 9/25, the stock had already dropped from its 6/3 high of 495 to 335.81 on 9/16—a pullback of more than 30%. The moving averages were just catching up with old news. Now the EMA50 at 366.94 and EMA200 at 370.05 are both overhead, but the price has moved back above the EMA12 at 354.28 and EMA26 at 358.70.
Daily KDJ(9,3,3): K 54.8, D 45.1, J 74.3. On 10/1, J was still at -0.9; it rebounded over two trading days, and today K crossed above D for a golden cross (the daily candle hasn’t closed, so this is provisional). ATR(14) is 10.63, just 2.9% of the share price. It briefly exceeded 23 in June, so volatility has been cut by more than half, and the selling pressure is fading.
Structurally, the highs have been stepping down: 432.73 (8/10), 372.70 (9/8), and 366.55 (9/22). The lows have started moving up: 335.81 (9/16) and 343.29 (10/1). That’s a converging triangle. The upper trendline coincides with the 9/22 prior high and the two long-term moving averages. This narrow band from 366.5 to 370 is just over $8 from the current price—less than one ATR.
My take: the death cross already did its damage in August. The real test is this narrow band. If the daily close can’t get above 370, the death cross will keep being trotted out as a reason to sell. If it falls back below 343.29, the triangle is invalidated, and I’ll admit I was wrong.
Those who think a drop must follow the death cross are watching the moving averages; I’m watching volatility, which has already been cut in half. We’ll probably know who’s right by the end of this week.
#美股 #博通 #TechnicalAnalysis
About 80 minutes after the U.S. market opened, $AVGO 361.55 was up 1.8% from Friday’s close of 355.14, with an intraday high of 362.60. At the same time, $NVDA was up 1.3%, QQQ was up 0.5%, and the 10-year Treasury yield was 5.31%. Volume was 5.18 million shares, about one-fifth of the 20-day average of 25.04 million—not exactly a surge in buying, even accounting for the time of day.
First, the death cross. When the EMA50 fell below the EMA200 on 9/25, the stock had already dropped from its 6/3 high of 495 to 335.81 on 9/16—a pullback of more than 30%. The moving averages were just catching up with old news. Now the EMA50 at 366.94 and EMA200 at 370.05 are both overhead, but the price has moved back above the EMA12 at 354.28 and EMA26 at 358.70.
Daily KDJ(9,3,3): K 54.8, D 45.1, J 74.3. On 10/1, J was still at -0.9; it rebounded over two trading days, and today K crossed above D for a golden cross (the daily candle hasn’t closed, so this is provisional). ATR(14) is 10.63, just 2.9% of the share price. It briefly exceeded 23 in June, so volatility has been cut by more than half, and the selling pressure is fading.
Structurally, the highs have been stepping down: 432.73 (8/10), 372.70 (9/8), and 366.55 (9/22). The lows have started moving up: 335.81 (9/16) and 343.29 (10/1). That’s a converging triangle. The upper trendline coincides with the 9/22 prior high and the two long-term moving averages. This narrow band from 366.5 to 370 is just over $8 from the current price—less than one ATR.
My take: the death cross already did its damage in August. The real test is this narrow band. If the daily close can’t get above 370, the death cross will keep being trotted out as a reason to sell. If it falls back below 343.29, the triangle is invalidated, and I’ll admit I was wrong.
Those who think a drop must follow the death cross are watching the moving averages; I’m watching volatility, which has already been cut in half. We’ll probably know who’s right by the end of this week.
#美股 #博通 #TechnicalAnalysis