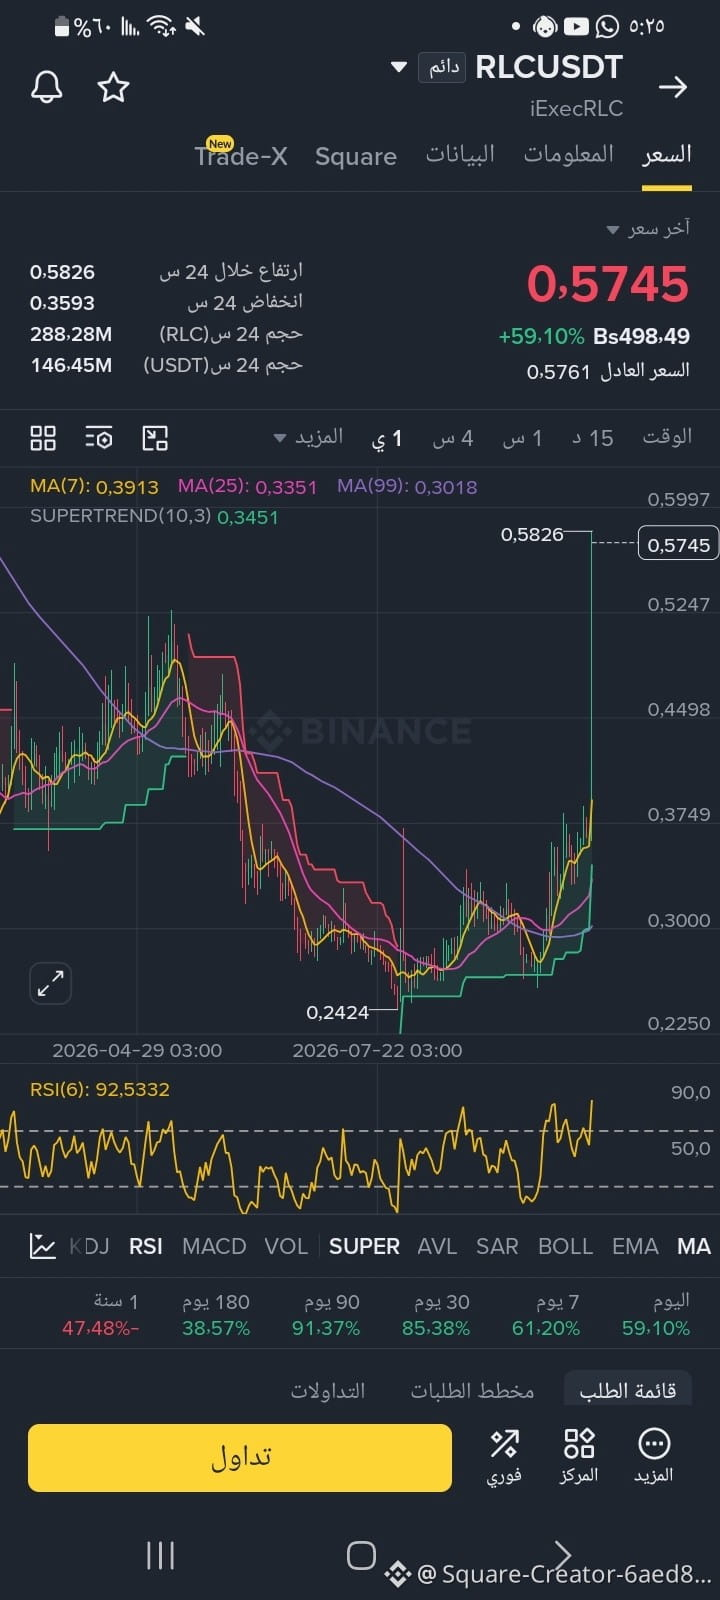
🚀 RLC/USDT price action analysis — Price explosion and +59% gains in one day! 📈
#RLC is showing exceptional performance today, breaking through all previous resistance levels, with the price reaching 0.5745 after touching a high of 0.5826!
📊 Chart analysis (timeframe: daily):
• Trend: A sharp, explosive uptrend backed by high liquidity.
• Moving averages: A clear bullish crossover, with the price moving far above the (MA7 / MA25 / MA99) averages.
• RSI: Around 92.5, indicating extreme overbought conditions.
⚠️ Advice and likely strategy:
The current rally is excellent for those who entered at lower levels, but entering with a direct buy (FOMO) at these levels carries high risk due to the possibility of a sudden pullback or profit-taking.
🔹 Levels to watch:
• Next resistance: $0.6000
• Healthy pullback support levels: $0.5250 - $0.4500
💡 This is not financial advice. Always manage your risk and follow your own strategy!
#RLC #BinanceSquare #CryptoAnalysis #Trading #USDT $RLC
#RLC is showing exceptional performance today, breaking through all previous resistance levels, with the price reaching 0.5745 after touching a high of 0.5826!
📊 Chart analysis (timeframe: daily):
• Trend: A sharp, explosive uptrend backed by high liquidity.
• Moving averages: A clear bullish crossover, with the price moving far above the (MA7 / MA25 / MA99) averages.
• RSI: Around 92.5, indicating extreme overbought conditions.
⚠️ Advice and likely strategy:
The current rally is excellent for those who entered at lower levels, but entering with a direct buy (FOMO) at these levels carries high risk due to the possibility of a sudden pullback or profit-taking.
🔹 Levels to watch:
• Next resistance: $0.6000
• Healthy pullback support levels: $0.5250 - $0.4500
💡 This is not financial advice. Always manage your risk and follow your own strategy!
#RLC #BinanceSquare #CryptoAnalysis #Trading #USDT $RLC