$BTC C Update: Bulls Still in Control, But Watch These Liquidity Zones 👀
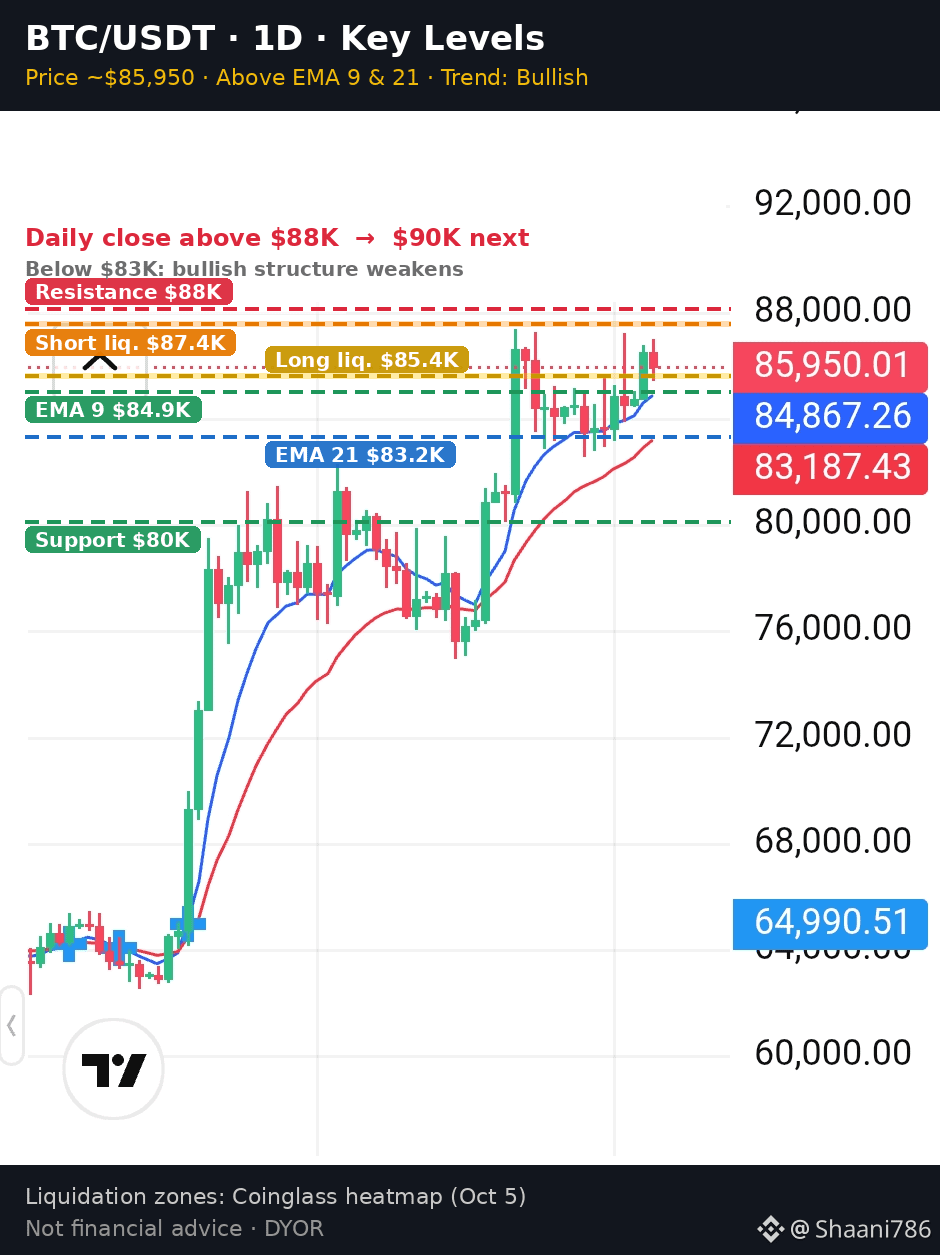
Bitcoin is trading around $85,950, holding above both the EMA 9 ($84,867) and EMA 21 ($83,187) on the daily chart. The trend structure remains bullish after the September breakout, with BTC up ~35% over the last 90 days.
📊 Key levels from the daily chart:
🔼 Resistance: $87,000 – $88,000 (recent range highs)
🔽 Support: $84,800 (EMA 9), then $83,200 (EMA 21), then $80,000
🔥 Liquidation heatmap (Coinglass):
• The strongest liquidity cluster sits just below price, around $85,400 – $85,500. A quick sweep there is possible before any move up.
• Above, short liquidations stack around $86,500 and $87,400, which could fuel a push toward $88K if bulls reclaim momentum.
• Deeper long liquidity sits near $84,700.
🧠 My view: As long as BTC holds above the EMA 9, dips look like buying opportunities. A daily close above $88K could open the path to $90K. Losing $83K would weaken the bullish structure.
What's your target for this week? 👇
#BTC #bitcoin #CryptoAnalysis" #BinanceSquare
Not financial advice. DYOR.
Bitcoin is trading around $85,950, holding above both the EMA 9 ($84,867) and EMA 21 ($83,187) on the daily chart. The trend structure remains bullish after the September breakout, with BTC up ~35% over the last 90 days.
📊 Key levels from the daily chart:
🔼 Resistance: $87,000 – $88,000 (recent range highs)
🔽 Support: $84,800 (EMA 9), then $83,200 (EMA 21), then $80,000
🔥 Liquidation heatmap (Coinglass):
• The strongest liquidity cluster sits just below price, around $85,400 – $85,500. A quick sweep there is possible before any move up.
• Above, short liquidations stack around $86,500 and $87,400, which could fuel a push toward $88K if bulls reclaim momentum.
• Deeper long liquidity sits near $84,700.
🧠 My view: As long as BTC holds above the EMA 9, dips look like buying opportunities. A daily close above $88K could open the path to $90K. Losing $83K would weaken the bullish structure.
What's your target for this week? 👇
#BTC #bitcoin #CryptoAnalysis" #BinanceSquare
Not financial advice. DYOR.