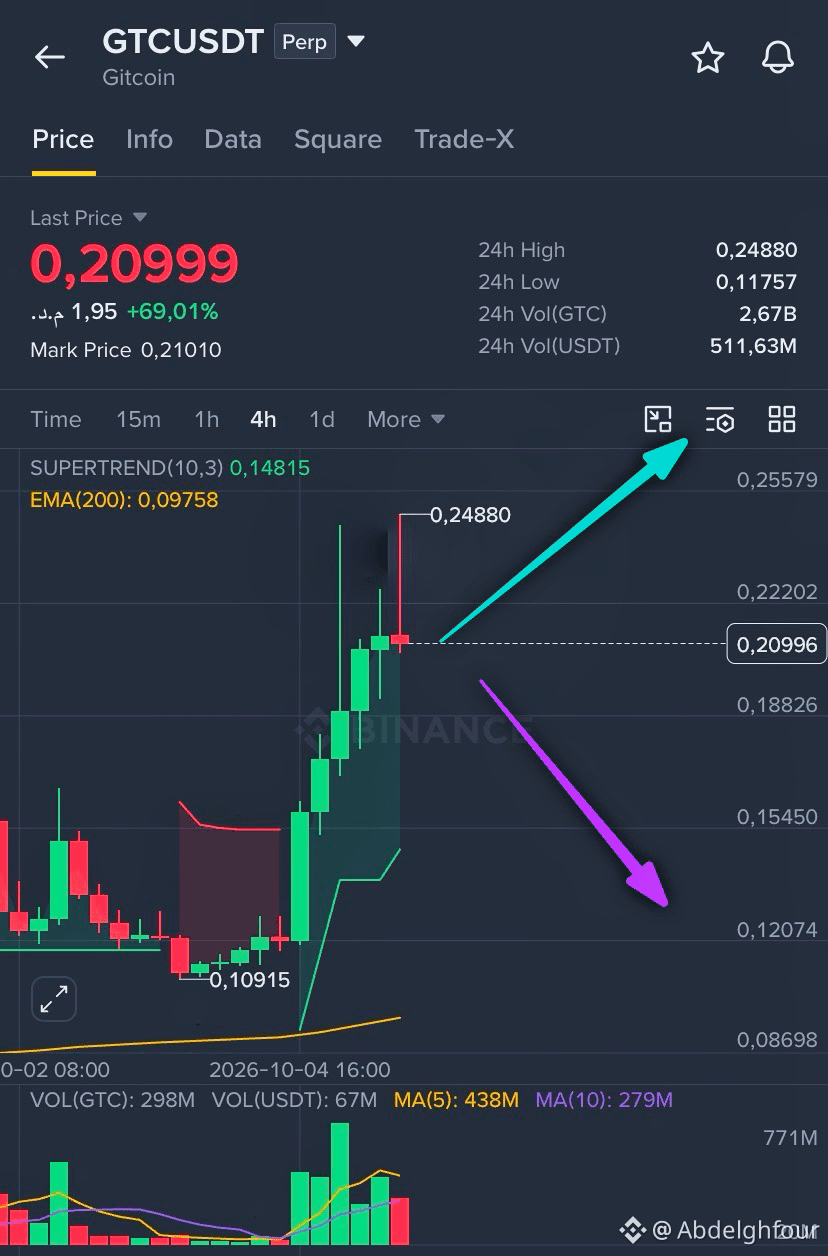
🔍 Analysis of $GTC (4-hour + 15-minute charts)
Current situation: Price is 0.2116 (up +70% in 24 hours).
📊 Indicators:
• SuperTrend (4-hour): Green at 0.1481 = overall trend is bullish.
• EMA 200 (4-hour): 0.0976 and price is above it = strong support.
• RSI (4-hour): 90.96 = extremely overbought!
• RSI (15-minute): 37.3 = has fallen from overbought territory; cooling has begun.
• MACD (15-minute): Bearish crossover (DIF below DEA) = short-term downward momentum.
• OBV (15-minute): Fell sharply from its peak = volume is starting to decline.
• Funding rate: -0.2301% (negative) = short sellers are paying; crowded shorts = squeeze risk.
• Liquidation map: Large liquidity concentration at 0.1811 - 0.2068 (below price) = price may be drawn toward it.
Summary: GTC is in a strong uptrend, but the 4-hour RSI is at 90 (extremely overbought), and the 15-minute MACD is bearish. This points to a likely near-term correction. However, the negative funding rate (-0.23%) means shorts are crowded, which could trigger a sudden rise. Signals are mixed → best to wait.
Decision: Wait.
Long scenario:
• Wait for a correction to 0.1950 - 0.2000.
• Entry condition: 15-minute MACD turns green + OBV resumes rising.
• Stop loss: Below 0.1850.
• Targets: 0.2300, then 0.2480.
Short scenario:
• Break below 0.1850 on high volume + 4-hour MACD turns bearish.
• Stop loss: Above 0.2100.
• Targets: 0.1700, then 0.1550
Trade $GTC from here👇👇
Current situation: Price is 0.2116 (up +70% in 24 hours).
📊 Indicators:
• SuperTrend (4-hour): Green at 0.1481 = overall trend is bullish.
• EMA 200 (4-hour): 0.0976 and price is above it = strong support.
• RSI (4-hour): 90.96 = extremely overbought!
• RSI (15-minute): 37.3 = has fallen from overbought territory; cooling has begun.
• MACD (15-minute): Bearish crossover (DIF below DEA) = short-term downward momentum.
• OBV (15-minute): Fell sharply from its peak = volume is starting to decline.
• Funding rate: -0.2301% (negative) = short sellers are paying; crowded shorts = squeeze risk.
• Liquidation map: Large liquidity concentration at 0.1811 - 0.2068 (below price) = price may be drawn toward it.
Summary: GTC is in a strong uptrend, but the 4-hour RSI is at 90 (extremely overbought), and the 15-minute MACD is bearish. This points to a likely near-term correction. However, the negative funding rate (-0.23%) means shorts are crowded, which could trigger a sudden rise. Signals are mixed → best to wait.
Decision: Wait.
Long scenario:
• Wait for a correction to 0.1950 - 0.2000.
• Entry condition: 15-minute MACD turns green + OBV resumes rising.
• Stop loss: Below 0.1850.
• Targets: 0.2300, then 0.2480.
Short scenario:
• Break below 0.1850 on high volume + 4-hour MACD turns bearish.
• Stop loss: Above 0.2100.
• Targets: 0.1700, then 0.1550
Trade $GTC from here👇👇