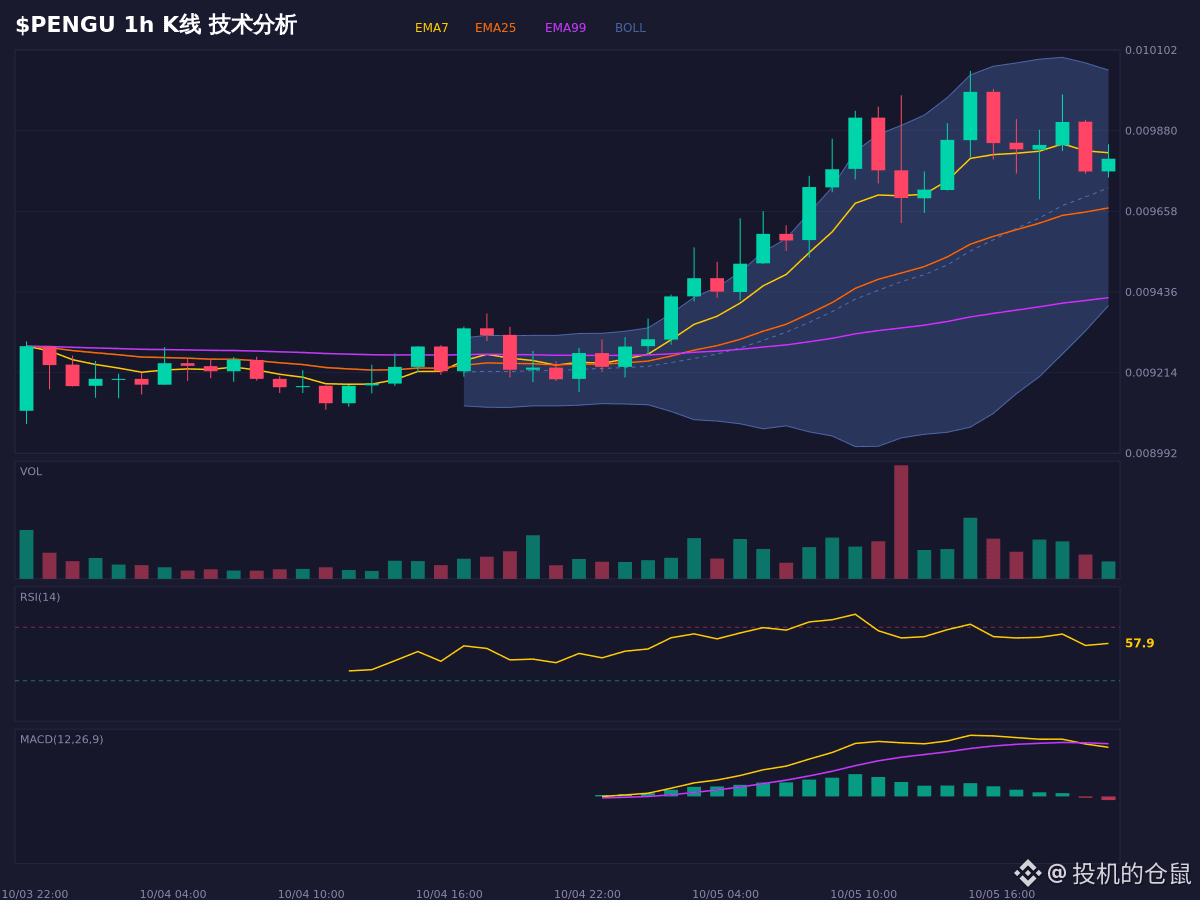
As a seasoned trader, I’ve been staring at the charts until my eyes are blurry. The price action for $PENGU is interesting: the moving averages are in a bullish alignment, and EMA7 is almost touching EMA25, so the trend is definitely strong. But MACD DIF is below DEA, and the histogram is still shrinking—that doesn’t quite match the price action. Stranger still, the long/short ratio shows long positions declining. How did the 72.9% long positioning drop? This rally feels a bit shaky.
Support is around 0.0096, where EMA25 is holding it up. Resistance is near the previous high of 0.010045. If it holds above 0.0097, the bullish structure could continue; if it breaks below 0.0095, the current thesis is invalidated.
For chart observation and conditional scenario analysis only; this is not a record of trading activity.
$PENGU #交易 #牛市 #PerpetualContract
Support is around 0.0096, where EMA25 is holding it up. Resistance is near the previous high of 0.010045. If it holds above 0.0097, the bullish structure could continue; if it breaks below 0.0095, the current thesis is invalidated.
For chart observation and conditional scenario analysis only; this is not a record of trading activity.
$PENGU #交易 #牛市 #PerpetualContract