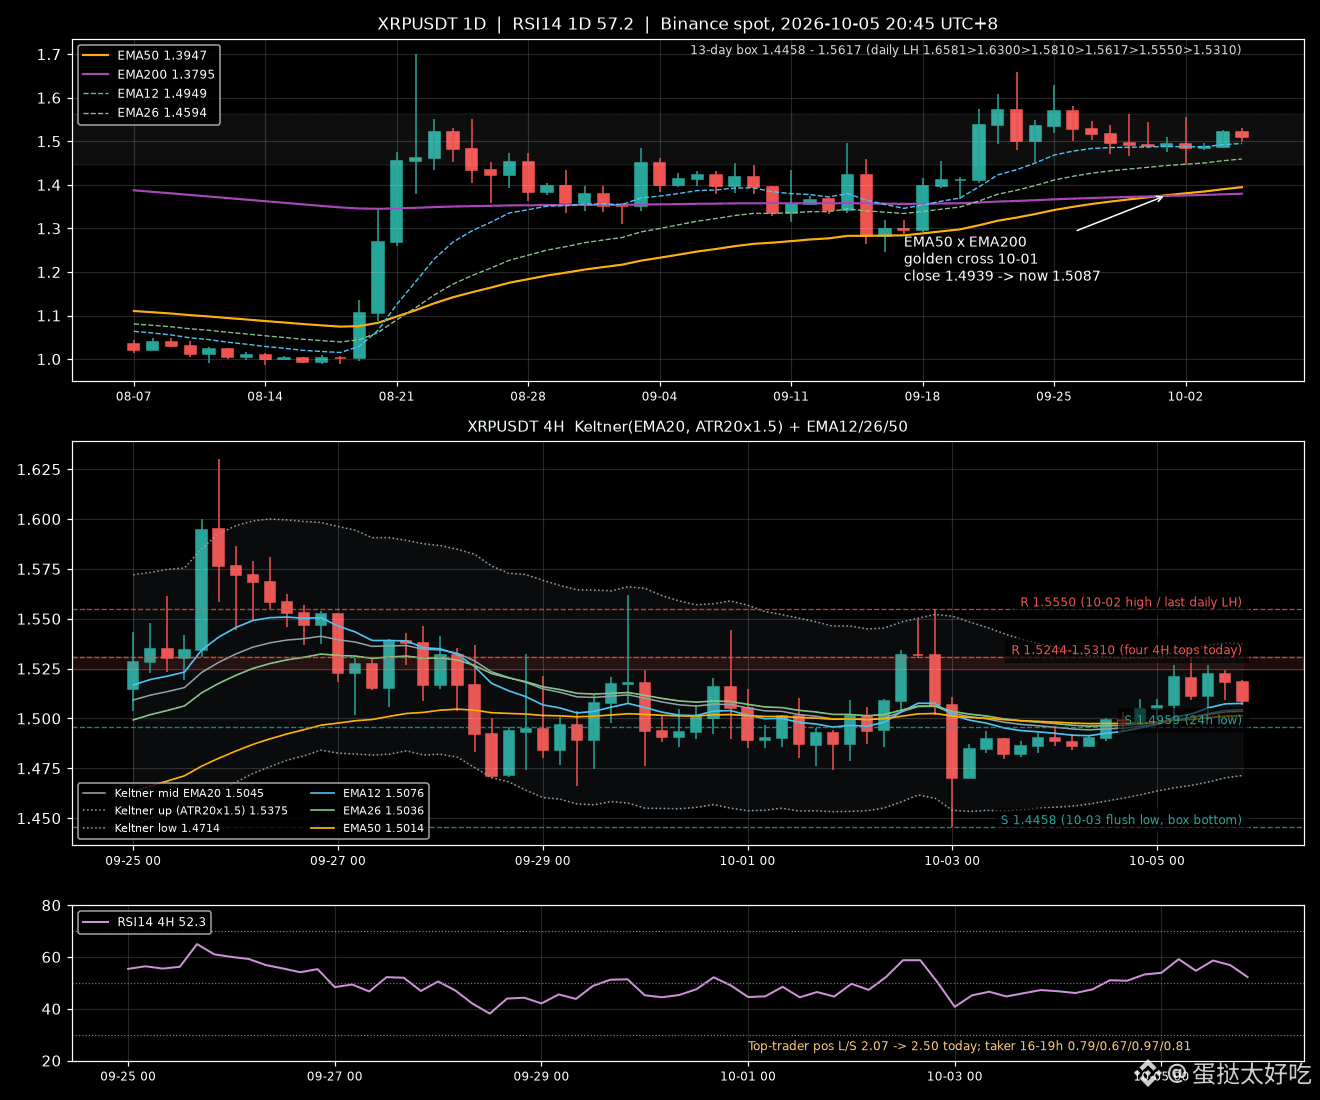
$XRP The daily EMA50 crossed above the EMA200 on October 1, and this is day 5 of the golden cross. Price has risen from 1.4939 to 1.5087, just 1%. I don't put much stock in this golden cross. It was fueled by September's rally, not by current momentum.
Daily EMA12/26/50/200 = 1.4949/1.4594/1.3947/1.3795—a nice alignment, but the EMA200 is almost flat. Daily volume has shrunk from 100–300 million tokens in late September to around 50 million over the past three days. Daily RSI(14) is 57.2 and 4H RSI is 52.3; both are hovering around the middle.
4H Keltner (EMA20, ATR20×1.5): middle band 1.5045, upper band 1.5375, lower band 1.4714. The channel position is 0.56, with price hugging the middle band. The 4H EMA12/26/50 are 1.5076/1.5036/1.5014, packed within 0.4% of each other—that's a tangle, not a trend.
The large-trader long/short ratio rose from 2.07 at 8 a.m. to 2.50 at 8 p.m., while OI climbed to 319.9 million tokens. But after the 4H high of 1.5310, the next highs were 1.5266 and 1.5244, while volume fell from 21.35 million to 13.75 million. After 4 p.m., the aggressive buy/sell ratios were 0.79, 0.67, 0.97, and 0.81. The orders pushing price upward keep getting absorbed.
The daily highs have kept stepping down from 1.6581 to today's 1.5310; the lower highs remain intact. After dipping to 1.4458 on October 3, the low climbed to 1.4992, and the triangle is narrowing. Resistance is the 1.5244–1.5310 cluster of highs, then 1.5550. Support is at 1.4959 (24h low), 1.4714 (Keltner lower band), and 1.4458 (range floor).
On the evening of October 2, price surged to 1.5550, then the very next 4H candle crashed to 1.4458. I expect a pullback first to 1.4959–1.4714 to find support. If the daily candle closes above 1.5550, I'll have been wrong.
Large traders are leaning 2.5-to-1 long on a golden cross with no volume. Some call it getting in early; I'd call it lining up.
#XRP #Futures Data
Daily EMA12/26/50/200 = 1.4949/1.4594/1.3947/1.3795—a nice alignment, but the EMA200 is almost flat. Daily volume has shrunk from 100–300 million tokens in late September to around 50 million over the past three days. Daily RSI(14) is 57.2 and 4H RSI is 52.3; both are hovering around the middle.
4H Keltner (EMA20, ATR20×1.5): middle band 1.5045, upper band 1.5375, lower band 1.4714. The channel position is 0.56, with price hugging the middle band. The 4H EMA12/26/50 are 1.5076/1.5036/1.5014, packed within 0.4% of each other—that's a tangle, not a trend.
The large-trader long/short ratio rose from 2.07 at 8 a.m. to 2.50 at 8 p.m., while OI climbed to 319.9 million tokens. But after the 4H high of 1.5310, the next highs were 1.5266 and 1.5244, while volume fell from 21.35 million to 13.75 million. After 4 p.m., the aggressive buy/sell ratios were 0.79, 0.67, 0.97, and 0.81. The orders pushing price upward keep getting absorbed.
The daily highs have kept stepping down from 1.6581 to today's 1.5310; the lower highs remain intact. After dipping to 1.4458 on October 3, the low climbed to 1.4992, and the triangle is narrowing. Resistance is the 1.5244–1.5310 cluster of highs, then 1.5550. Support is at 1.4959 (24h low), 1.4714 (Keltner lower band), and 1.4458 (range floor).
On the evening of October 2, price surged to 1.5550, then the very next 4H candle crashed to 1.4458. I expect a pullback first to 1.4959–1.4714 to find support. If the daily candle closes above 1.5550, I'll have been wrong.
Large traders are leaning 2.5-to-1 long on a golden cross with no volume. Some call it getting in early; I'd call it lining up.
#XRP #Futures Data