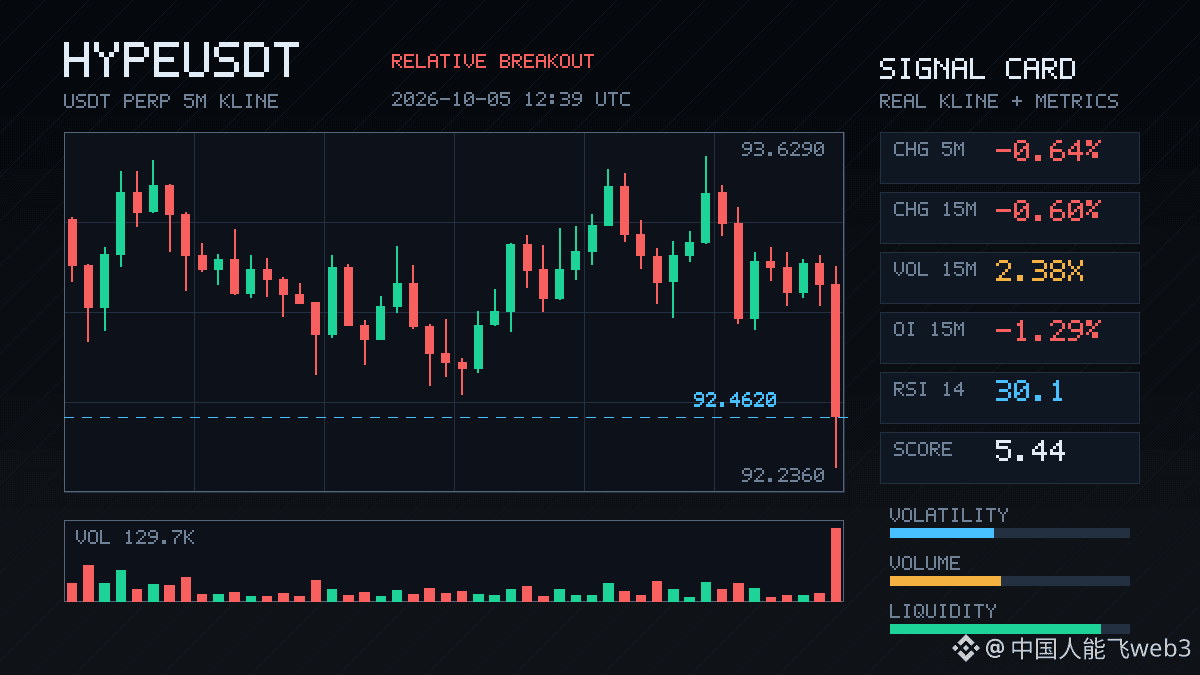
$HYPE : This drop isn’t deep, but the structure looks off.
Price broke below the lows of nearly the last 20 five-minute candles. The aggressive trade imbalance is -47.7%, the buy/sell ratio is 0.35, and selling pressure is in control. The key issue isn’t the 0.6% drop—it’s that OI is falling at the same time: down 1.29% over 15 minutes, or -7.3M in notional terms, and it’s also contracting on the one-hour timeframe. Price down + OI down is typical deleveraging—not new shorts piling in to drive the price lower, but longs getting liquidated.
Volume is 2.38 times normal, and the OI anomaly percentile has hit 100%, ranking second across the entire pool. This combination is interesting: volume is up, but positions are shrinking, which suggests some traders are being forced out—through stop-losses or involuntary position cuts.
The 24-hour trading volume is still 428 million, so liquidity isn’t lacking. This looks more like a localized squeeze than a broad collapse. But price is already near a historical extreme, so deleveraging at this level could trigger a cascade.
First, watch for OI to stop falling. If price keeps grinding lower and OI continues to drop, this move isn’t over yet.
Price broke below the lows of nearly the last 20 five-minute candles. The aggressive trade imbalance is -47.7%, the buy/sell ratio is 0.35, and selling pressure is in control. The key issue isn’t the 0.6% drop—it’s that OI is falling at the same time: down 1.29% over 15 minutes, or -7.3M in notional terms, and it’s also contracting on the one-hour timeframe. Price down + OI down is typical deleveraging—not new shorts piling in to drive the price lower, but longs getting liquidated.
Volume is 2.38 times normal, and the OI anomaly percentile has hit 100%, ranking second across the entire pool. This combination is interesting: volume is up, but positions are shrinking, which suggests some traders are being forced out—through stop-losses or involuntary position cuts.
The 24-hour trading volume is still 428 million, so liquidity isn’t lacking. This looks more like a localized squeeze than a broad collapse. But price is already near a historical extreme, so deleveraging at this level could trigger a cascade.
First, watch for OI to stop falling. If price keeps grinding lower and OI continues to drop, this move isn’t over yet.