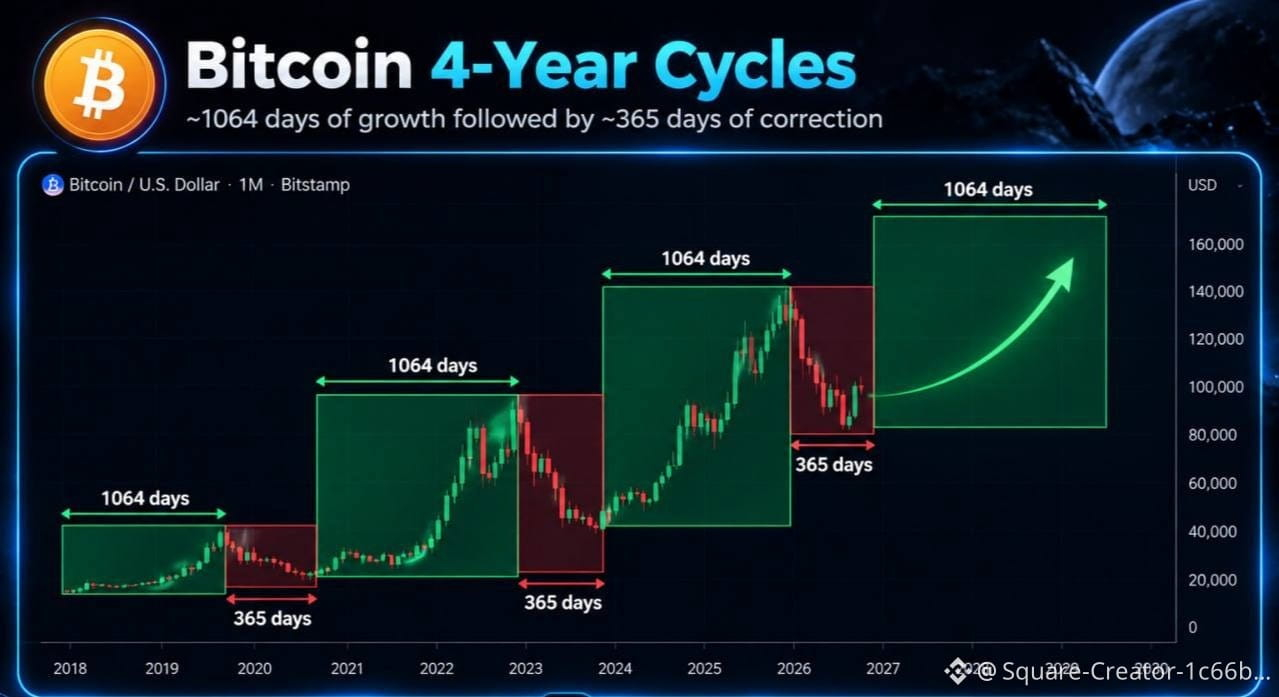
📊 Is Bitcoin repeating its historical cycle?
🗓 Since 2017, Bitcoin (BTC) has shown a recurring time-based pattern:
📈 ~1,064 days of rising
📉 ~365 days of falling
🔄 This pattern has repeated 3 times, and we are now approaching a similar time window 🟫
Based on this historical model, the period from October to November may be an important timeframe for forming a potential Bitcoin bottom, with the $60K–$65K range as a key area to watch 🗣️
If the cycle repeats, Bitcoin could enter a new bullish phase lasting several years 🔼📣
$BTC
#BinanceSquareTalks
#Bitcoin #BTC #Bitcoin #العملات_الرقمية #Trading #Crypto #Technical_Analysis #Cryptocurrency_Market #Crypto #تداول_العملات_الرقمية
🗓 Since 2017, Bitcoin (BTC) has shown a recurring time-based pattern:
📈 ~1,064 days of rising
📉 ~365 days of falling
🔄 This pattern has repeated 3 times, and we are now approaching a similar time window 🟫
Based on this historical model, the period from October to November may be an important timeframe for forming a potential Bitcoin bottom, with the $60K–$65K range as a key area to watch 🗣️
If the cycle repeats, Bitcoin could enter a new bullish phase lasting several years 🔼📣
$BTC
#BinanceSquareTalks
#Bitcoin #BTC #Bitcoin #العملات_الرقمية #Trading #Crypto #Technical_Analysis #Cryptocurrency_Market #Crypto #تداول_العملات_الرقمية