$AXS Technical Analysis of $AXS / USDT — Strong Breakout and Retest Phase
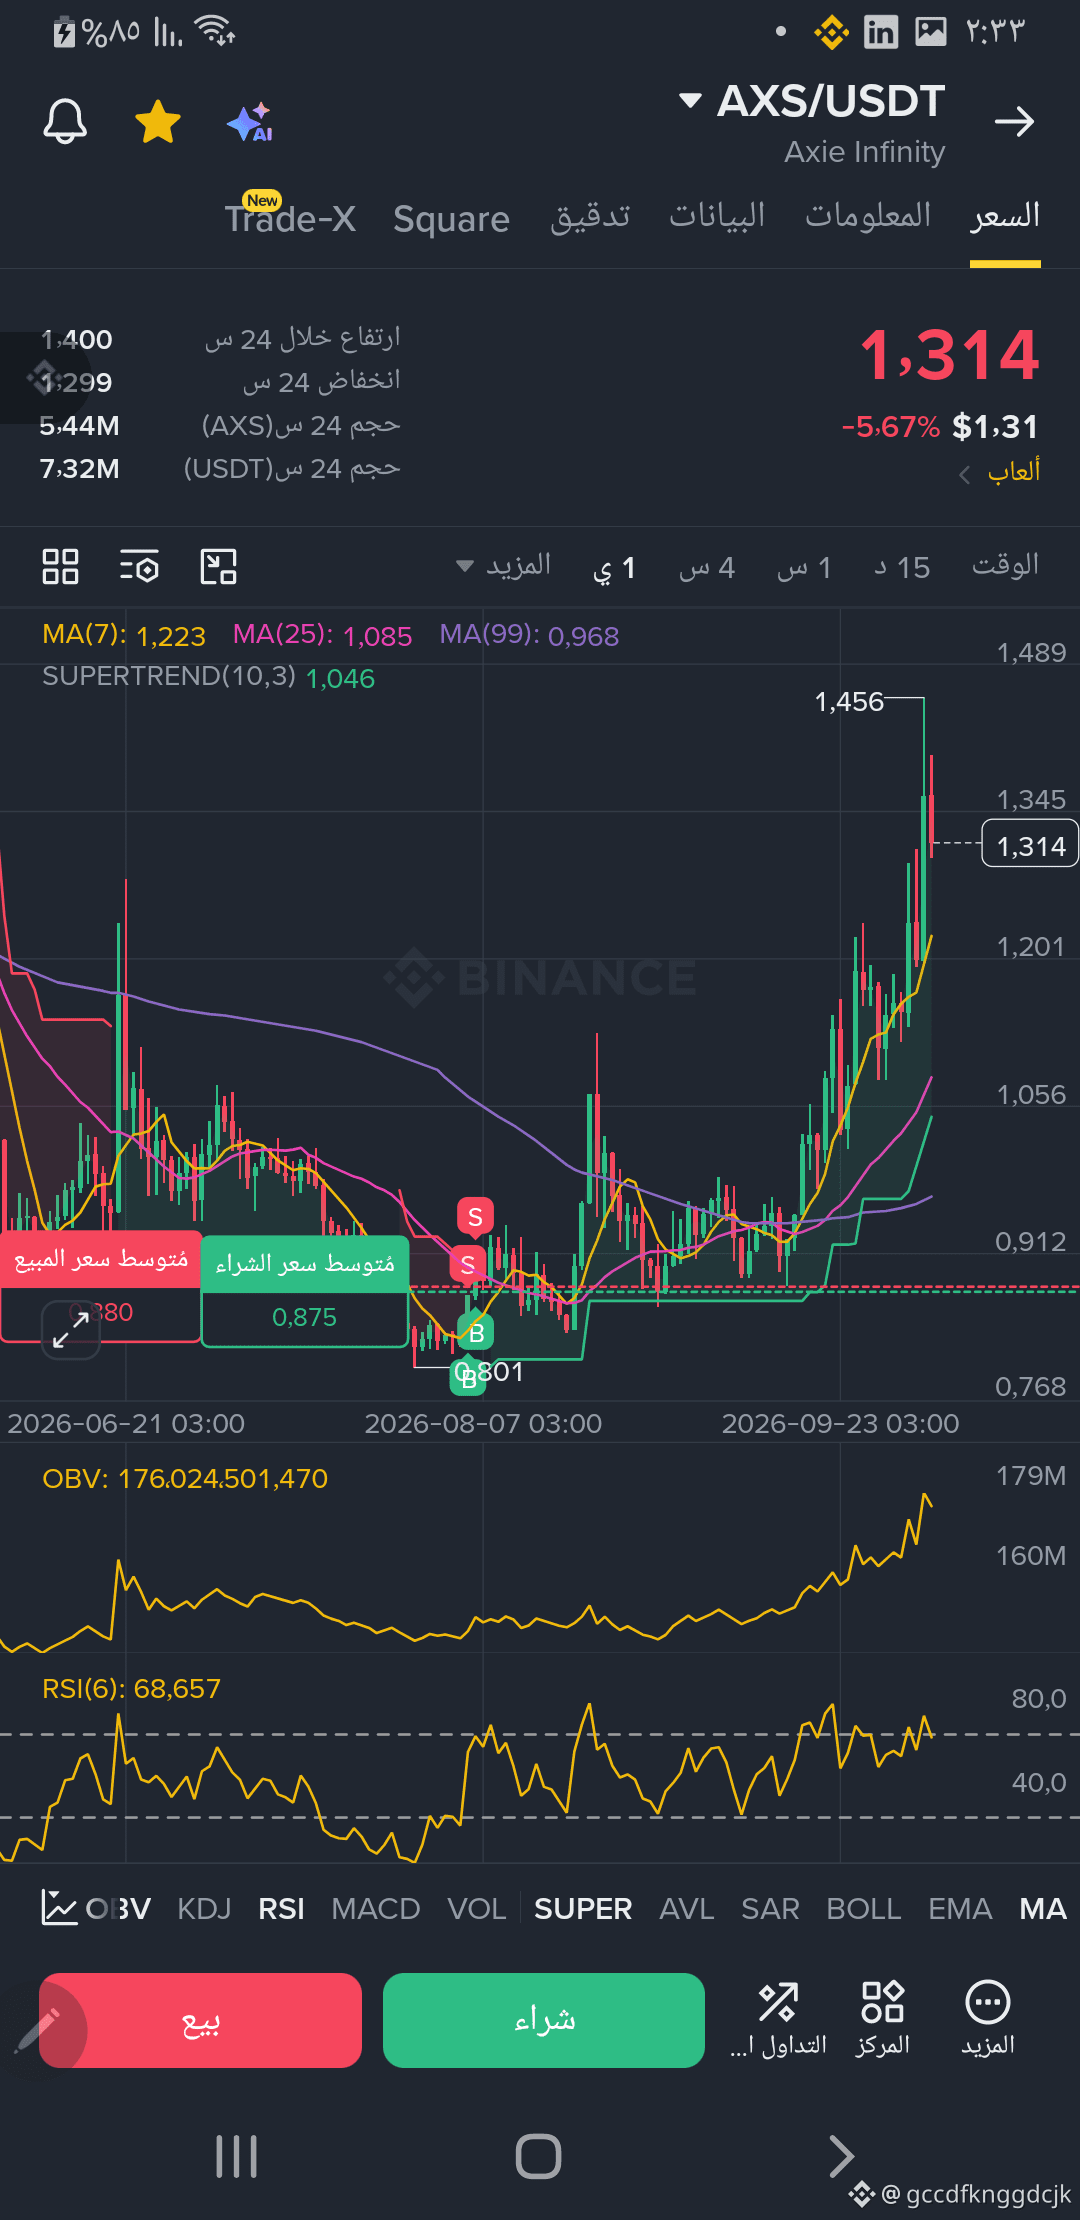
AXS (Axie Infinity) is showing sharp positive momentum after a strong rally that took it to a high of 1.456, before entering a normal pullback to retest the breakout.
🔹 Key Technical Data:
Current price: The coin is trading at 1.314, down 5.67% on the day as a result of profit-taking following the rapid rise.
Moving averages and support levels:
Nearby support is at the MA(7) moving average, at 1.223.
The next major support is at the MA(25) moving average, near 1.085.
The SuperTrend indicator gives a strategic bullish signal at 1.046.
46.
Trading volume and liquidity (OBV): The OBV indicator shows a strong, clear rise to 176M, indicating a substantial inflow of buying liquidity that supports the continuation of the uptrend.
Relative Strength Index (RSI 6): It stands at 68.65, close to overbought territory, but reflects the strength of current momentum.
💡 Overall outlook:
The coin is in a clear uptrend following the breakout. Holding above the 1.220–1.250 support zone could pave the way for another rise, targeting the 1.456 high and then the 1.500 area. However, a break below 1.220 could lead to a deeper correction toward 1.080–1.100 before another rebound.
⚠️ Caution: Price movements in high-momentum coins in the “gaming” category can be rapid. Please trade cautiously and manage risk carefully.
#BinanceSquare #AXS #CryptoAnalysis #AxieInfinity #TechnicalAnalysis
AXS (Axie Infinity) is showing sharp positive momentum after a strong rally that took it to a high of 1.456, before entering a normal pullback to retest the breakout.
🔹 Key Technical Data:
Current price: The coin is trading at 1.314, down 5.67% on the day as a result of profit-taking following the rapid rise.
Moving averages and support levels:
Nearby support is at the MA(7) moving average, at 1.223.
The next major support is at the MA(25) moving average, near 1.085.
The SuperTrend indicator gives a strategic bullish signal at 1.046.
46.
Trading volume and liquidity (OBV): The OBV indicator shows a strong, clear rise to 176M, indicating a substantial inflow of buying liquidity that supports the continuation of the uptrend.
Relative Strength Index (RSI 6): It stands at 68.65, close to overbought territory, but reflects the strength of current momentum.
💡 Overall outlook:
The coin is in a clear uptrend following the breakout. Holding above the 1.220–1.250 support zone could pave the way for another rise, targeting the 1.456 high and then the 1.500 area. However, a break below 1.220 could lead to a deeper correction toward 1.080–1.100 before another rebound.
⚠️ Caution: Price movements in high-momentum coins in the “gaming” category can be rapid. Please trade cautiously and manage risk carefully.
#BinanceSquare #AXS #CryptoAnalysis #AxieInfinity #TechnicalAnalysis