BNB Technical Analysis & Actionable Trading Tips
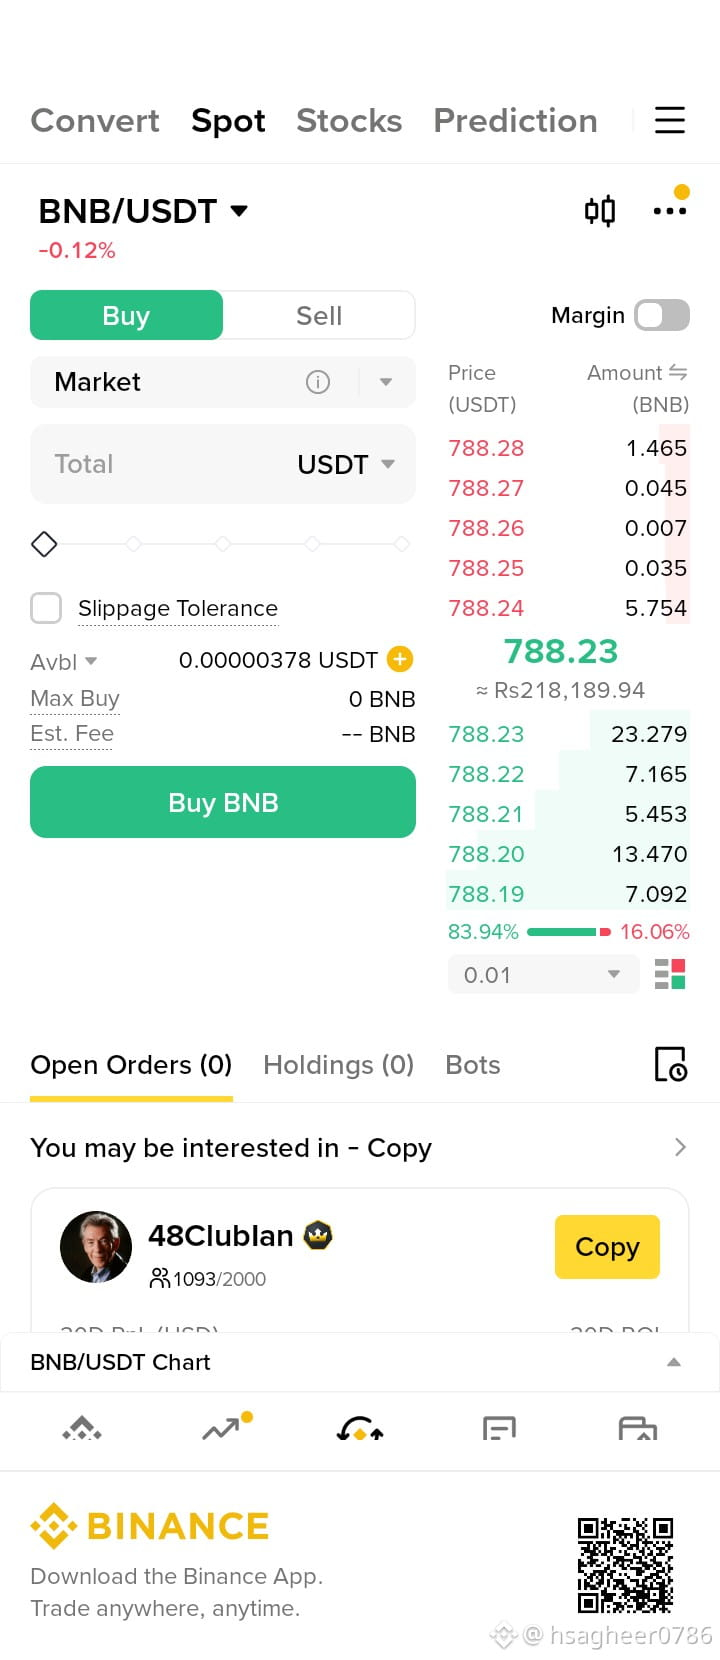
BNB is consolidating in the $770–$785 range following mild market pullbacks, staying well above its critical multi-month exponential moving averages. While long-term bullish market structure remains intact, short-term momentum signals point to sideways compression prior to its upcoming quarterly supply burn event.
Key Technical Overview
Moving Average Structure: The 100-day EMA ($678) remains safely above the 200-day EMA ($673). Short-term dynamic resistance rests near the 20-day EMA (~$755), acting as a key level for bulls to defend on lower timeframes.
Momentum Indicators:
RSI (14-period): Floating around 58–62, indicating neutral-to-bullish control with plenty of room before hitting overbought extremes.
MACD: Daily histogram reflects minor momentum deceleration following a rejection near local supply zones, signaling a potential squeeze setup.
Catalysts: Anticipation surrounding the 37th quarterly BNB token auto-burn continues to maintain spot demand and reduce total circulating supply.
Key Technical Levels
Level TypePrice RangeContext & SignificanceMajor Resistance$800.00 – $815.00Multi-month overhead supply zone; a 4-hour close above opens $840+.Immediate Pivot$775.00 – $785.00Current consolidation zone and intraday liquidity point.Dynamic Support$750.00 – $755.00Confluence of the 20-day EMA and high-volume order block.Invalidation Line$730.00Structural swing low; closing below invalidates short-term bullish bias.
Actionable Trading Strategies
1. Dip-Buying Strategy (Support Retest)
Entry Zone: Scale in near $755.00 – $765.00 on a retest of dynamic moving average support.
Targets: Take partial profits at $795.00 and target $815.00 for the remainder.
Stop Loss: Set a tight stop below $745.00.
2. Breakout Expansion Setup
Trigger Entry: Wait for a confirmed 4-hour candle close above $802.00 accompanied by expanding volume.
$BNB
#bnb一輩子 #bnblauncpool #BNBbull
BNB is consolidating in the $770–$785 range following mild market pullbacks, staying well above its critical multi-month exponential moving averages. While long-term bullish market structure remains intact, short-term momentum signals point to sideways compression prior to its upcoming quarterly supply burn event.
Key Technical Overview
Moving Average Structure: The 100-day EMA ($678) remains safely above the 200-day EMA ($673). Short-term dynamic resistance rests near the 20-day EMA (~$755), acting as a key level for bulls to defend on lower timeframes.
Momentum Indicators:
RSI (14-period): Floating around 58–62, indicating neutral-to-bullish control with plenty of room before hitting overbought extremes.
MACD: Daily histogram reflects minor momentum deceleration following a rejection near local supply zones, signaling a potential squeeze setup.
Catalysts: Anticipation surrounding the 37th quarterly BNB token auto-burn continues to maintain spot demand and reduce total circulating supply.
Key Technical Levels
Level TypePrice RangeContext & SignificanceMajor Resistance$800.00 – $815.00Multi-month overhead supply zone; a 4-hour close above opens $840+.Immediate Pivot$775.00 – $785.00Current consolidation zone and intraday liquidity point.Dynamic Support$750.00 – $755.00Confluence of the 20-day EMA and high-volume order block.Invalidation Line$730.00Structural swing low; closing below invalidates short-term bullish bias.
Actionable Trading Strategies
1. Dip-Buying Strategy (Support Retest)
Entry Zone: Scale in near $755.00 – $765.00 on a retest of dynamic moving average support.
Targets: Take partial profits at $795.00 and target $815.00 for the remainder.
Stop Loss: Set a tight stop below $745.00.
2. Breakout Expansion Setup
Trigger Entry: Wait for a confirmed 4-hour candle close above $802.00 accompanied by expanding volume.
$BNB
#bnb一輩子 #bnblauncpool #BNBbull