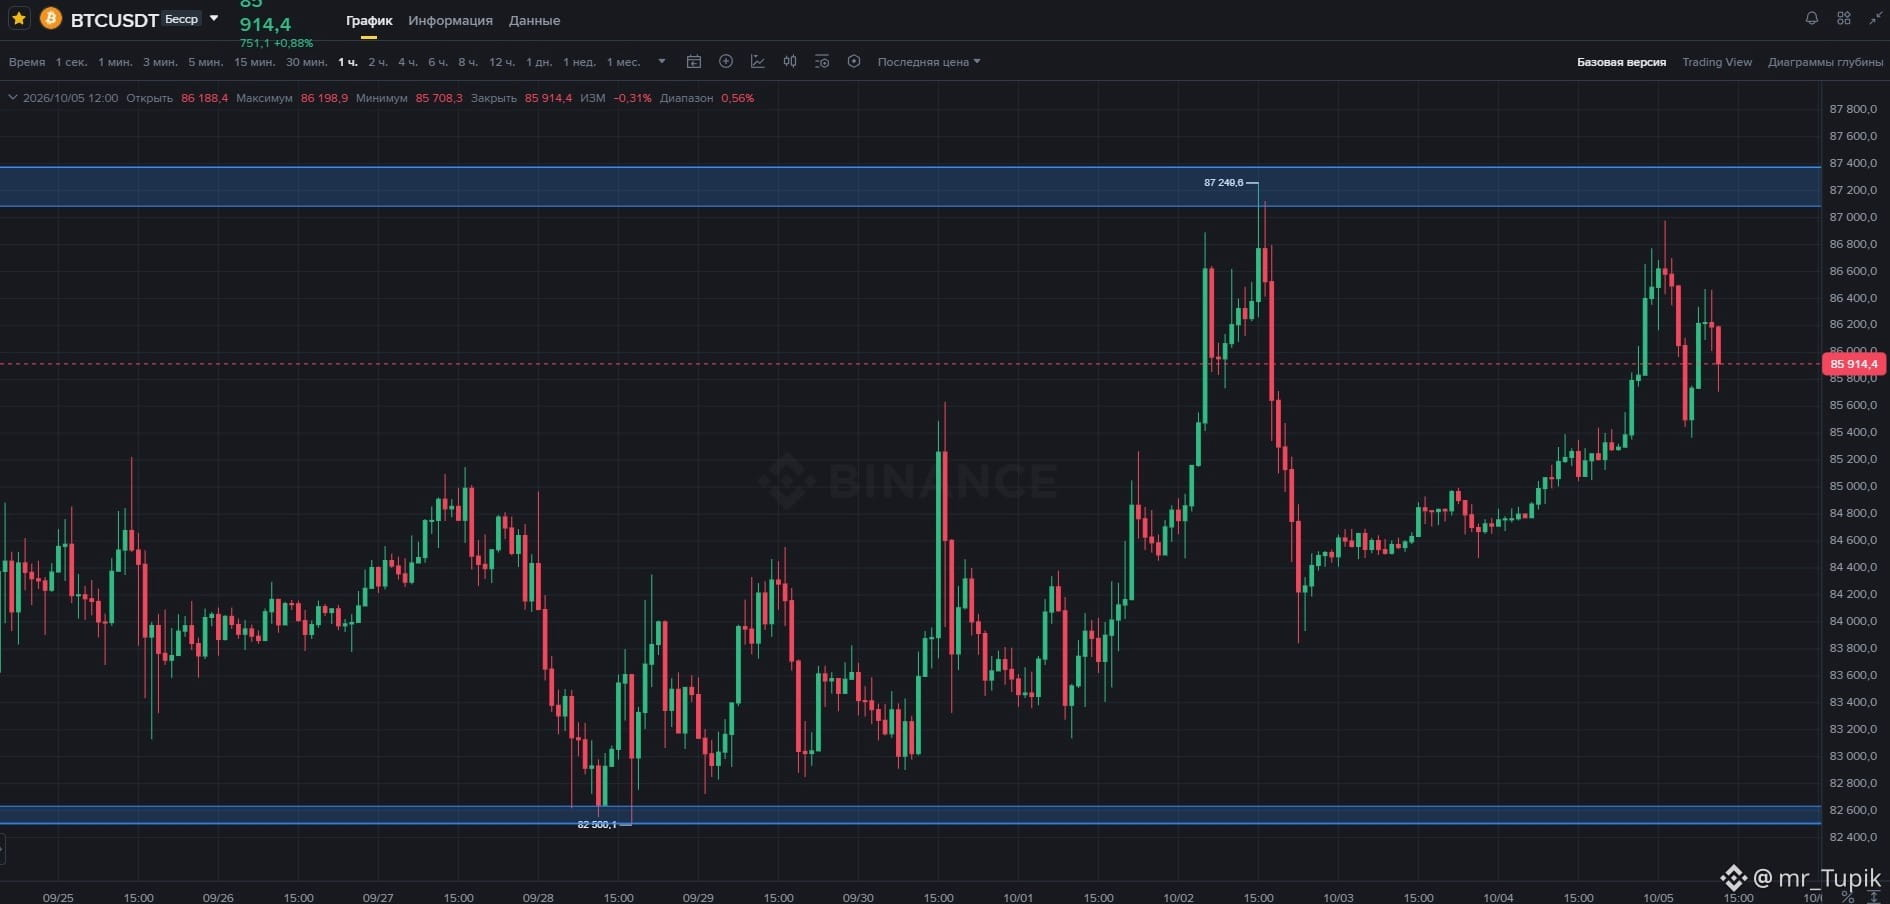
📉 The news is stormy, but Price Action sees everything. What’s going on with BTC?
While analysts debate US macro data (weak NFP, rising Treasury yields), news feeds are shouting about a push toward $90,000. Bitcoin briefly hit $86,995, but failed to hold above the psychological $87,000 level.
Indicators go haywire and lag at times like these. So what does the naked chart say?
-False breakout (Deviation): The impulsive move above $87,000 swept short sellers’ stops, after which the price immediately pulled back. For PA, this is a signal that a major player isn’t ready to push the market higher without accumulation.
-Selling pressure: The drop to $85,900 proves there are large limit orders overhead. The rise in the dollar index was reflected on the chart instantly, without any oscillators.
-Downside support: $300 million in inflows into spot ETFs over two days is holding local support, preventing the price from dropping further.
🧠 Price Action logic:
We’re range-bound. The key trigger for a long is a convincing daily candle close above $87,000. Until then, any wicks upward are just a hunt for your liquidity.
While BTC is treading water, altcoins are surging — Cardano (ADA) is up 10%. And that move also calls for reading the clean structure, not indicators.
How did you trade this impulse? Let us know in the comments 👇
While analysts debate US macro data (weak NFP, rising Treasury yields), news feeds are shouting about a push toward $90,000. Bitcoin briefly hit $86,995, but failed to hold above the psychological $87,000 level.
Indicators go haywire and lag at times like these. So what does the naked chart say?
-False breakout (Deviation): The impulsive move above $87,000 swept short sellers’ stops, after which the price immediately pulled back. For PA, this is a signal that a major player isn’t ready to push the market higher without accumulation.
-Selling pressure: The drop to $85,900 proves there are large limit orders overhead. The rise in the dollar index was reflected on the chart instantly, without any oscillators.
-Downside support: $300 million in inflows into spot ETFs over two days is holding local support, preventing the price from dropping further.
🧠 Price Action logic:
We’re range-bound. The key trigger for a long is a convincing daily candle close above $87,000. Until then, any wicks upward are just a hunt for your liquidity.
While BTC is treading water, altcoins are surging — Cardano (ADA) is up 10%. And that move also calls for reading the clean structure, not indicators.
How did you trade this impulse? Let us know in the comments 👇