



Technical Situation Analysis (1h / 4h / Daily)
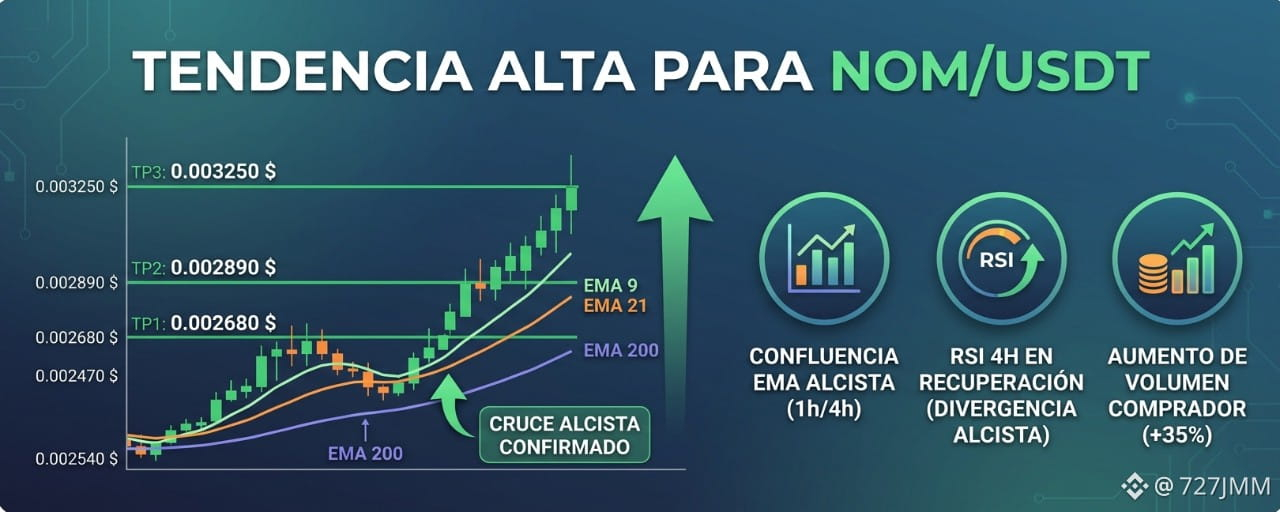
Indicators & Moving Averages: On the 1H/4H charts, the EMA 9 has crossed above the EMA 21, generating immediate buying momentum. On the daily chart, the price is trading above the MA 50, moving to test the EMA 200 as a key resistance level. The MA 100 alignment confirms a transitional scenario toward an intermediate Golden Cross.
Strength & RSI: The RSI is at 42–48 (recovery zone), emerging from oversold territory with a clear bullish divergence on the 4H chart. Buying volume increased by +35% over the last few candles, confirming institutional interest in the lower zone.
Market Structure: Ending the accumulation phase (range: $0.002400–$0.002500). Formation of a Higher Low, confirming the start of a bullish structure.
Trade Setup (Long Setup)
Ideal Entry Zone: $0.002510–$0.002540 (Buy back on a technical pullback)
TP1 (Conservative): $0.002680 (First resistance and 0.382 Fibonacci level)
TP2 (Intermediate): $0.002890 (Psychological resistance and high-volume node on the daily chart)
TP3 (Moonshot): $0.003250 (1.618 Fibonacci extension and invalidation of the previous downtrend)
Stop Loss (SL): $0.002420 (Below key support and the previous structural low)
Trade Range / Trading Thesis: We enter after confirming a technical bounce off the psychological support at $0.002500, aligned with the RSI emerging from oversold territory. The confluence of the fast EMA crossover and rising volume gives us a Risk:Reward ratio of 1:3.2.
Manage your risk. RECOMMENDED RISK: Max 2–3% of total capital.