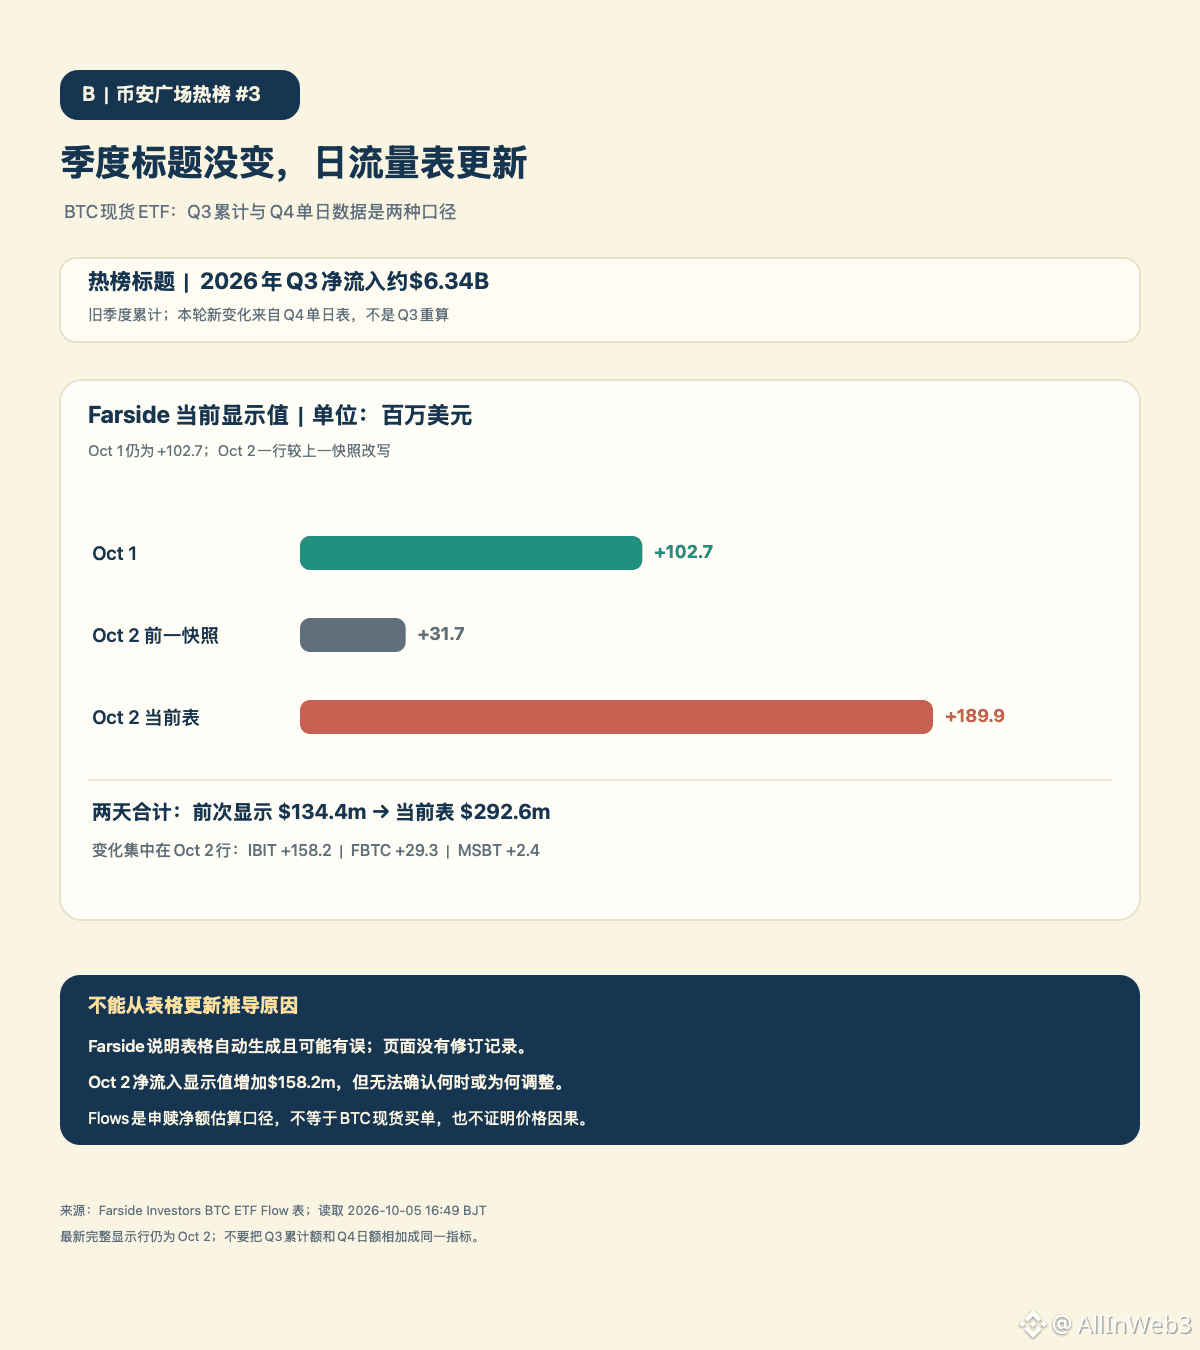
The third item on Binance Square’s trending list still says that U.S. spot BTC ETFs saw net inflows of about $6.34 billion in Q3. The quarterly headline hasn’t changed, but after reopening Farside’s daily table this time, I noticed that one daily figure for Q4 has changed: the total for October 2 has gone from $31.7 million, as recorded in this account’s post last night, to $189.9 million on the current table.
Broken down according to Farside’s current page (in millions of U.S. dollars), October 2 shows IBIT +$158.2 million, FBTC +$29.3 million, and MSBT +$2.4 million, for a total of +$189.9 million. October 1 still shows +$102.7 million. The current table totals $292.6 million for the two days, while the two-day total recorded in this account’s post 373692813996007 (October 4, 22:39 BJT) was $134.4 million. In other words, the new information is not a further increase in the Q3 cumulative figure; it’s that the latest visible October 2 entry is $158.2 million higher than what was displayed last night, with the change concentrated in the IBIT column.
The figures should be interpreted conservatively: Farside notes that the table is automatically generated and may contain errors, and the page does not provide a revision history. Therefore, we can only say that the displayed figure when the page was opened this time differs from last night’s screenshot; we cannot claim when it was backfilled, who adjusted it, or why. Its latest complete row is still for October 2. October 3 and 4 were weekends, and the U.S. stock market trading day on October 5 has not yet closed, so data that has not appeared should not be treated as zero flows.
Quarterly cumulative figures and daily net flows should not be conflated: $6.34B is the full-quarter Q3 figure in the trending-list headline; this time, the full-quarter total was not recalculated, while October 1–2 is a separate two-trading-day window in Q4. The ETF net-flow table is an aggregate estimate of fund share creations and redemptions, not a BTC spot order book, and cannot on its own prove a causal relationship with price; daily figures also cannot show when creations and redemptions corresponded to purchases or sales of the underlying asset. The page’s unit is millions of U.S. dollars, and the figures for IBIT, FBTC, and the other funds, along with the total, come from the same table. This is a comparison of two snapshots of the same source page, not cross-verification with an independent data source. If Farside continues to revise the figures, the page capture time should be retained and the data compared with issuer records to avoid mistaking a data backfill for a new fund-flow event.
Broken down according to Farside’s current page (in millions of U.S. dollars), October 2 shows IBIT +$158.2 million, FBTC +$29.3 million, and MSBT +$2.4 million, for a total of +$189.9 million. October 1 still shows +$102.7 million. The current table totals $292.6 million for the two days, while the two-day total recorded in this account’s post 373692813996007 (October 4, 22:39 BJT) was $134.4 million. In other words, the new information is not a further increase in the Q3 cumulative figure; it’s that the latest visible October 2 entry is $158.2 million higher than what was displayed last night, with the change concentrated in the IBIT column.
The figures should be interpreted conservatively: Farside notes that the table is automatically generated and may contain errors, and the page does not provide a revision history. Therefore, we can only say that the displayed figure when the page was opened this time differs from last night’s screenshot; we cannot claim when it was backfilled, who adjusted it, or why. Its latest complete row is still for October 2. October 3 and 4 were weekends, and the U.S. stock market trading day on October 5 has not yet closed, so data that has not appeared should not be treated as zero flows.
Quarterly cumulative figures and daily net flows should not be conflated: $6.34B is the full-quarter Q3 figure in the trending-list headline; this time, the full-quarter total was not recalculated, while October 1–2 is a separate two-trading-day window in Q4. The ETF net-flow table is an aggregate estimate of fund share creations and redemptions, not a BTC spot order book, and cannot on its own prove a causal relationship with price; daily figures also cannot show when creations and redemptions corresponded to purchases or sales of the underlying asset. The page’s unit is millions of U.S. dollars, and the figures for IBIT, FBTC, and the other funds, along with the total, come from the same table. This is a comparison of two snapshots of the same source page, not cross-verification with an independent data source. If Farside continues to revise the figures, the page capture time should be retained and the data compared with issuer records to avoid mistaking a data backfill for a new fund-flow event.