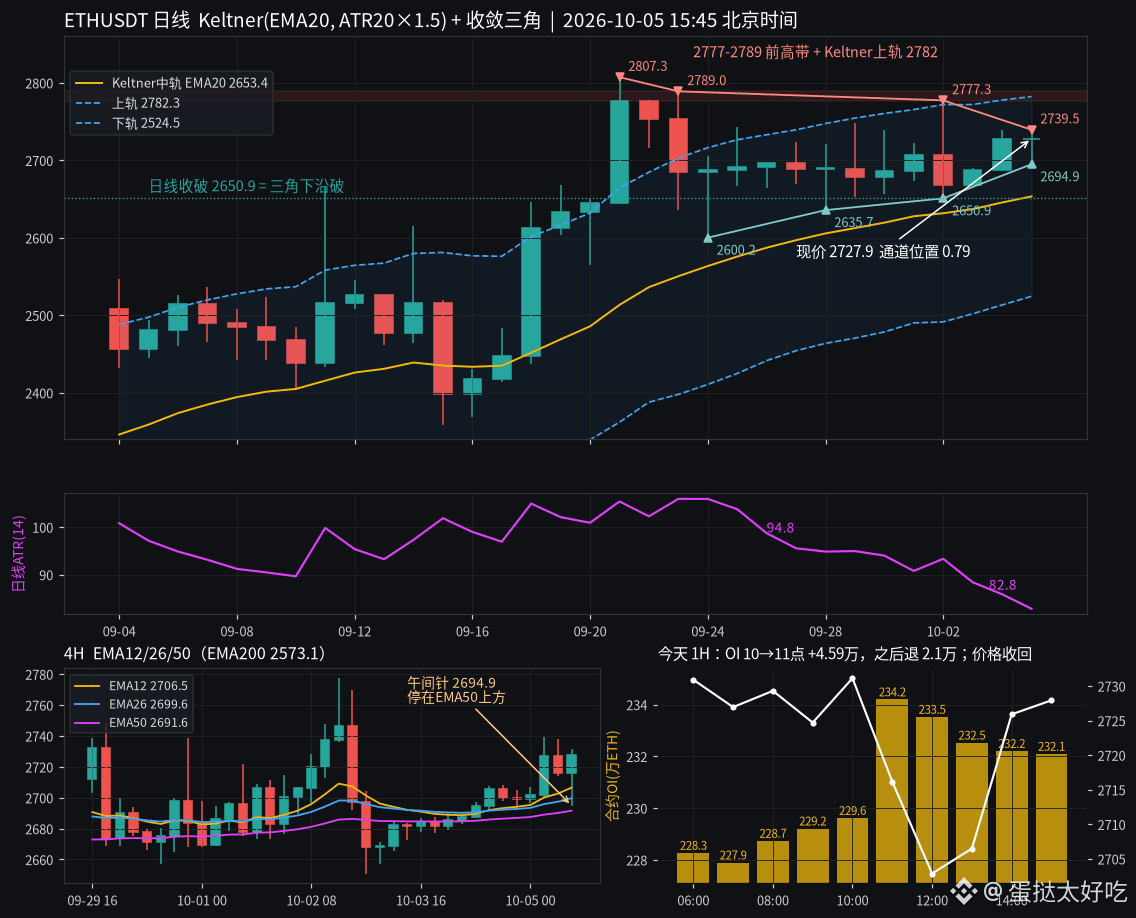
$ETH At noon, the price plunged from 2731 to 2694.9, and quite a few people said the morning breakout had failed. I think the drop was a good thing: nearly half of the longs that chased in at 10:00 were shaken out, and the price returned to 2728 within two hours.
OI surged from 2.2961 million at 10:00 to 2.3420 million at 11:00, adding 45,900 in an hour. Those positions were chasing around 2738. After the sell-off, OI had fallen back to 2.3209 million by 15:00, a drop of 21,000. The price recovered, but OI did not—the rebound wasn't driven by new leverage. The large-trader long/short ratio rose from 1.575 at 1:00 a.m. to 1.706, and kept rising during the hours of the decline. The funding rate is 0.0073%, so things aren't overheated.
4H EMA12/26/50/200: 2706.5 / 2699.7 / 2691.6 / 2573.1—a bullish alignment. The noon wick pierced EMA26, then stopped above EMA50 and recovered.
The daily chart is forming a converging triangle: the highs are 2807.3, 2789, 2777.3, and today's 2739.5, each lower than the last; the lows are 2600.2, 2635.7, 2650.9, and today's 2694.9, each higher than the last. The daily ATR(14) has contracted from 94.8 to 82.8 over eight days.
Daily Keltner (EMA20, ATR20×1.5): middle band 2653.4, upper band 2782.3, lower band 2524.5. The current price is at 0.79 within the channel. The upper band sits right on top of the previous-high zone at 2777–2789, the toughest resistance in two weeks.
If the 4H candle closes below 2691, this shakeout will have been for nothing; a daily close below 2650.9 would break the triangle's lower edge and invalidate the pattern. To the upside, the price first needs to clear 2739.5, then test 2777–2789.
I lean toward a move higher to test that resistance this week. Leverage has just been cleared out once, so the market is lighter than it was this morning. But 2777 has rejected price three times in two weeks, so I'm only halfway convinced by the claim that “the fourth test is bound to break through.”
#ETH #以太坊 #Technical Analysis
OI surged from 2.2961 million at 10:00 to 2.3420 million at 11:00, adding 45,900 in an hour. Those positions were chasing around 2738. After the sell-off, OI had fallen back to 2.3209 million by 15:00, a drop of 21,000. The price recovered, but OI did not—the rebound wasn't driven by new leverage. The large-trader long/short ratio rose from 1.575 at 1:00 a.m. to 1.706, and kept rising during the hours of the decline. The funding rate is 0.0073%, so things aren't overheated.
4H EMA12/26/50/200: 2706.5 / 2699.7 / 2691.6 / 2573.1—a bullish alignment. The noon wick pierced EMA26, then stopped above EMA50 and recovered.
The daily chart is forming a converging triangle: the highs are 2807.3, 2789, 2777.3, and today's 2739.5, each lower than the last; the lows are 2600.2, 2635.7, 2650.9, and today's 2694.9, each higher than the last. The daily ATR(14) has contracted from 94.8 to 82.8 over eight days.
Daily Keltner (EMA20, ATR20×1.5): middle band 2653.4, upper band 2782.3, lower band 2524.5. The current price is at 0.79 within the channel. The upper band sits right on top of the previous-high zone at 2777–2789, the toughest resistance in two weeks.
If the 4H candle closes below 2691, this shakeout will have been for nothing; a daily close below 2650.9 would break the triangle's lower edge and invalidate the pattern. To the upside, the price first needs to clear 2739.5, then test 2777–2789.
I lean toward a move higher to test that resistance this week. Leverage has just been cleared out once, so the market is lighter than it was this morning. But 2777 has rejected price three times in two weeks, so I'm only halfway convinced by the claim that “the fourth test is bound to break through.”
#ETH #以太坊 #Technical Analysis