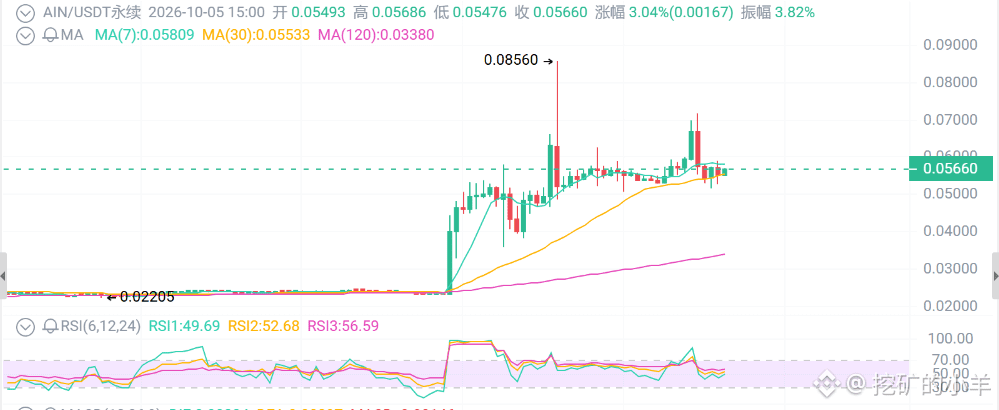
AIN at $0.056—did you catch the move?
First, the surface-level picture: On September 15, it plunged from $0.19 to $0.023 in a single day, an 86% drop. How many people saw their accounts wiped out? Then it surged 80% in a day on October 3, hit $0.072 on the 4th, and gained 155% in seven days. Its market cap is only a few tens of millions, yet daily trading volume has exploded to $300 million.
The daily chart has a long upper wick, RSI is back at 57, the 4-hour chart is neutral, and the 15-minute chart is already below the moving averages. This is price stalling after a short squeeze—not new money coming in.
First: The surge is shorts getting out, not bulls buying in
Funding rate: +0.15% every 4 hours, or over 300% annualized
If you go long, you pay shorts every 4 hours. That’s six payments a day, or 300% a year.
Open interest is at $20 million and still falling over 24 hours, while the price is hovering near its highs
Shorts are closing out and leaving; longs are stubbornly holding on and paying the funding
This isn’t the start of a bull market—it’s the tail end of a short squeeze
Second: Fundamentals? This move has absolutely nothing to do with them
AIN is Infinity Ground, a tool for generating on-chain applications with AI agents. It only launched in July 2025, with 185 million tokens in circulation—just 18.5% of the total supply. Its native L2 hasn’t launched yet, and there have been no new product or funding announcements since the September 15 crash
So why is it going up? Because the market is small, because the circulating supply is low, and because someone needs to pump it to sell into the rally
Third: The technicals have already given you the answer
It rallied from $0.024 to $0.072 in two days, tripling in price, then pulled back with a long upper wick. This is a classic distribution pattern after a V-shaped rebound, not a breakout from consolidation
Only a daily close above $0.062 that holds there would open the door to a second leg. A close below $0.048 would end this recovery, with the next levels at $0.040 or even $0.024
With a coin like this, 20%–30% moves in a day are normal. From $0.056, it could hit $0.048 or $0.072 within a few hours
Trading strategy
1. At the current price of $0.056, this is the midpoint of the pullback, with $0.062 and $0.072 overhead. Wait for a 4-hour close to hold above $0.062 and for the funding rate to come down before looking toward $0.072. Set a stop below $0.052
2. Only buy the pullback, and be quick. If price finds support in the $0.050–$0.048 range with a long lower wick, you could try a tiny position for a bounce. Stop below $0.045; targets: $0.056/$0.060
3. For a short-term short, sell into a rally.
If it rebounds to $0.065–$0.072 on rising volume, forms an upper wick, and fails to reclaim that range, take a small short. Stop above $0.076; targets: $0.056/$0.050
4. Invalidation conditions:
If the daily close falls below $0.048, exit all long positions. If there’s news of a token unlock, a market maker withdrawing liquidity, or exchange risk controls, reduce your exposure immediately. Without new product or exchange-listing news, treat anything above $0.072 as a bull trap.
First, the surface-level picture: On September 15, it plunged from $0.19 to $0.023 in a single day, an 86% drop. How many people saw their accounts wiped out? Then it surged 80% in a day on October 3, hit $0.072 on the 4th, and gained 155% in seven days. Its market cap is only a few tens of millions, yet daily trading volume has exploded to $300 million.
The daily chart has a long upper wick, RSI is back at 57, the 4-hour chart is neutral, and the 15-minute chart is already below the moving averages. This is price stalling after a short squeeze—not new money coming in.
First: The surge is shorts getting out, not bulls buying in
Funding rate: +0.15% every 4 hours, or over 300% annualized
If you go long, you pay shorts every 4 hours. That’s six payments a day, or 300% a year.
Open interest is at $20 million and still falling over 24 hours, while the price is hovering near its highs
Shorts are closing out and leaving; longs are stubbornly holding on and paying the funding
This isn’t the start of a bull market—it’s the tail end of a short squeeze
Second: Fundamentals? This move has absolutely nothing to do with them
AIN is Infinity Ground, a tool for generating on-chain applications with AI agents. It only launched in July 2025, with 185 million tokens in circulation—just 18.5% of the total supply. Its native L2 hasn’t launched yet, and there have been no new product or funding announcements since the September 15 crash
So why is it going up? Because the market is small, because the circulating supply is low, and because someone needs to pump it to sell into the rally
Third: The technicals have already given you the answer
It rallied from $0.024 to $0.072 in two days, tripling in price, then pulled back with a long upper wick. This is a classic distribution pattern after a V-shaped rebound, not a breakout from consolidation
Only a daily close above $0.062 that holds there would open the door to a second leg. A close below $0.048 would end this recovery, with the next levels at $0.040 or even $0.024
With a coin like this, 20%–30% moves in a day are normal. From $0.056, it could hit $0.048 or $0.072 within a few hours
Trading strategy
1. At the current price of $0.056, this is the midpoint of the pullback, with $0.062 and $0.072 overhead. Wait for a 4-hour close to hold above $0.062 and for the funding rate to come down before looking toward $0.072. Set a stop below $0.052
2. Only buy the pullback, and be quick. If price finds support in the $0.050–$0.048 range with a long lower wick, you could try a tiny position for a bounce. Stop below $0.045; targets: $0.056/$0.060
3. For a short-term short, sell into a rally.
If it rebounds to $0.065–$0.072 on rising volume, forms an upper wick, and fails to reclaim that range, take a small short. Stop above $0.076; targets: $0.056/$0.050
4. Invalidation conditions:
If the daily close falls below $0.048, exit all long positions. If there’s news of a token unlock, a market maker withdrawing liquidity, or exchange risk controls, reduce your exposure immediately. Without new product or exchange-listing news, treat anything above $0.072 as a bull trap.