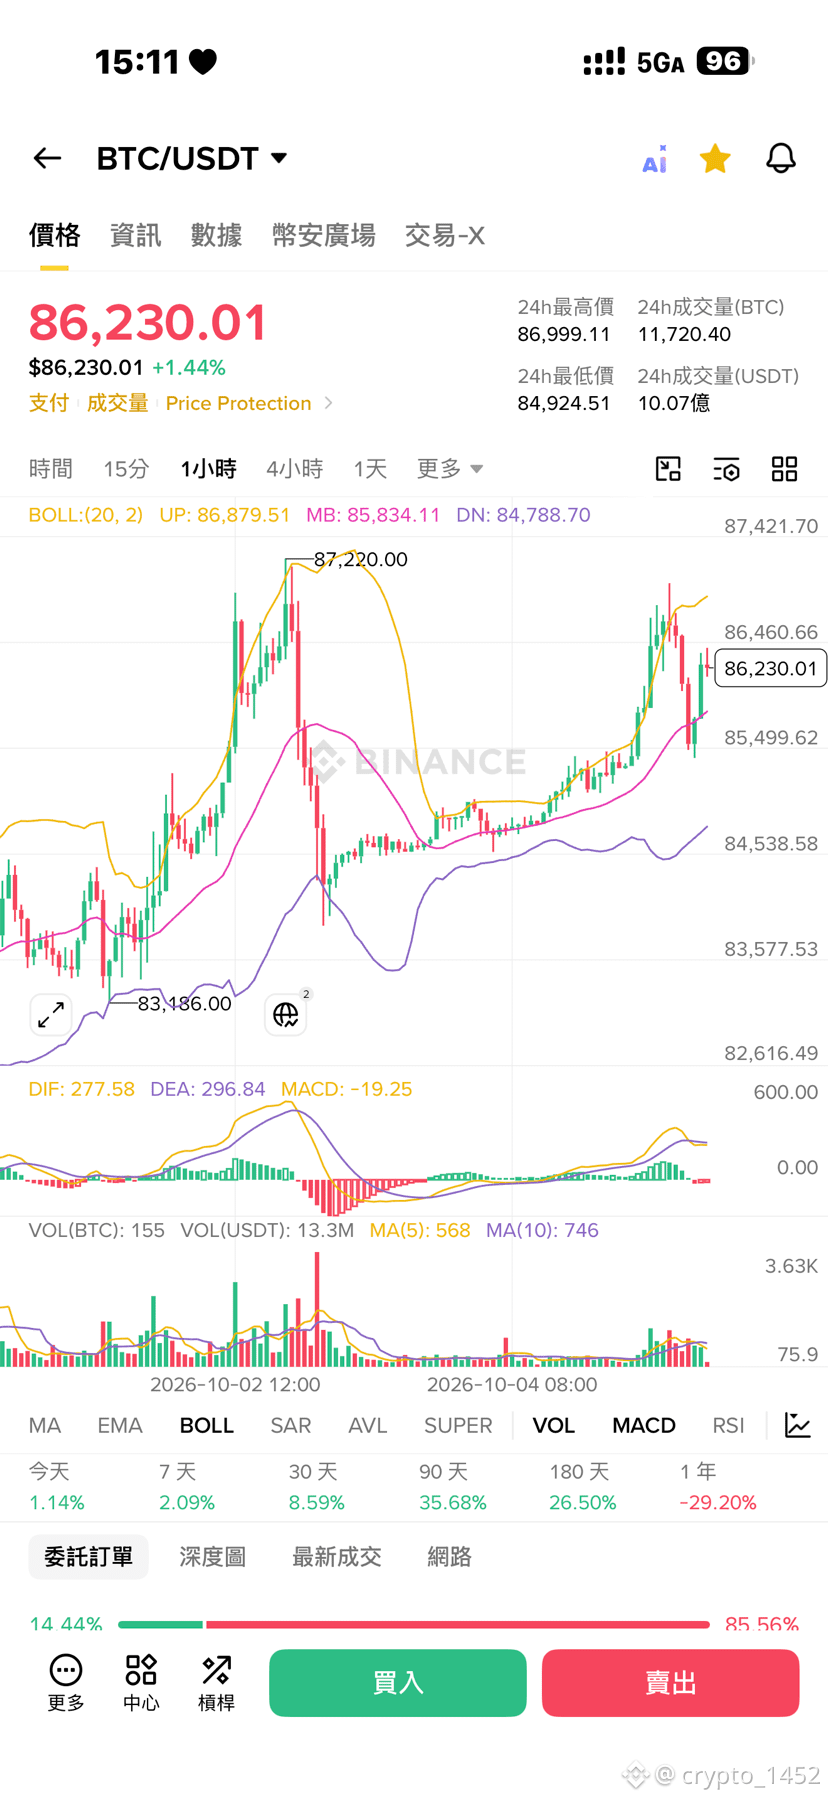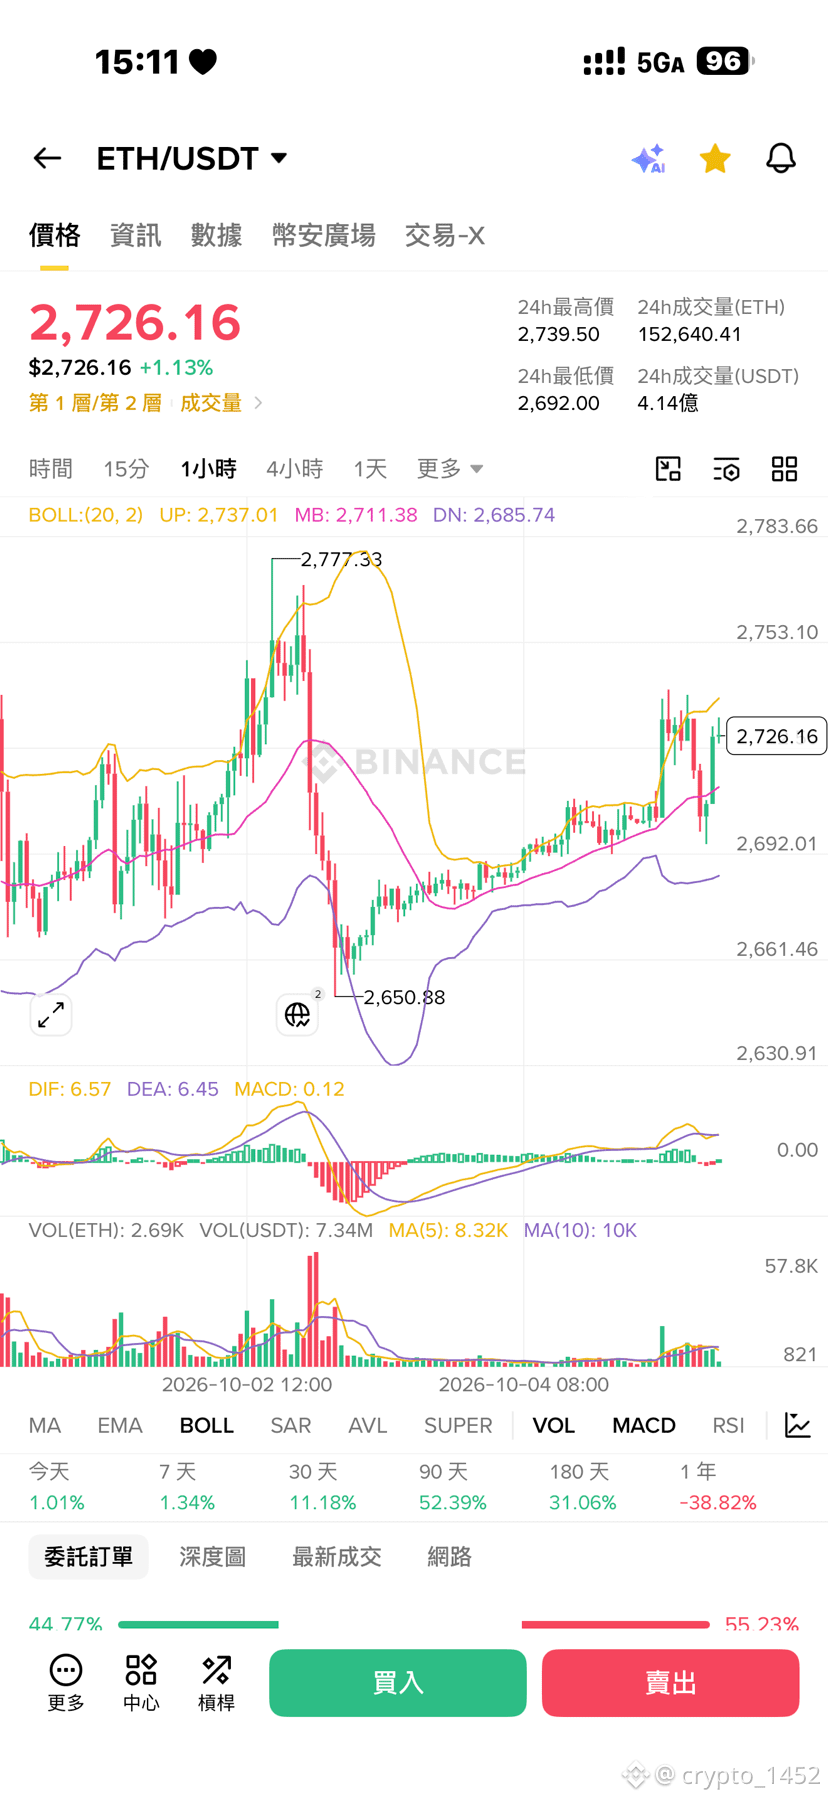
Market data shows that ETH rose 70% in the third quarter, outperforming BTC, which gained 42% over the same period, but ETH’s market liquidity declined. From July 6 to September 30, ETH’s median daily market depth was equivalent to just 35% to 45% of BTC’s, compared with at least 60% during the same period last year.
Within 0.15% of the market price, ETH’s bid and ask depth was approximately $13 million to $14 million. Market depth measures the volume of orders posted near the current price; the lower the depth, the more easily large orders can move the price.
Despite the contraction in liquidity, market depth on both the bid and ask sides exceeded $1 million on most trading platforms. SOL’s liquidity also declined: its one-sided market depth within 2% of its price fell from about $28 million last year to around $20 million.
XRP’s total market depth remained steady at around $30 million, including about $18 million in bids and $14 million in asks. Although XRP’s market capitalization is about 40% higher than SOL’s, its market depth is lower because SOL’s average daily trading volume remains about 25% higher.$BTC
$ETH
$XRP
Within 0.15% of the market price, ETH’s bid and ask depth was approximately $13 million to $14 million. Market depth measures the volume of orders posted near the current price; the lower the depth, the more easily large orders can move the price.
Despite the contraction in liquidity, market depth on both the bid and ask sides exceeded $1 million on most trading platforms. SOL’s liquidity also declined: its one-sided market depth within 2% of its price fell from about $28 million last year to around $20 million.
XRP’s total market depth remained steady at around $30 million, including about $18 million in bids and $14 million in asks. Although XRP’s market capitalization is about 40% higher than SOL’s, its market depth is lower because SOL’s average daily trading volume remains about 25% higher.$BTC
$ETH
$XRP