

📊 Technical Analysis — $COAI
⏱️ Time Frame: 3D
💰 Current Price: Around $0.3327
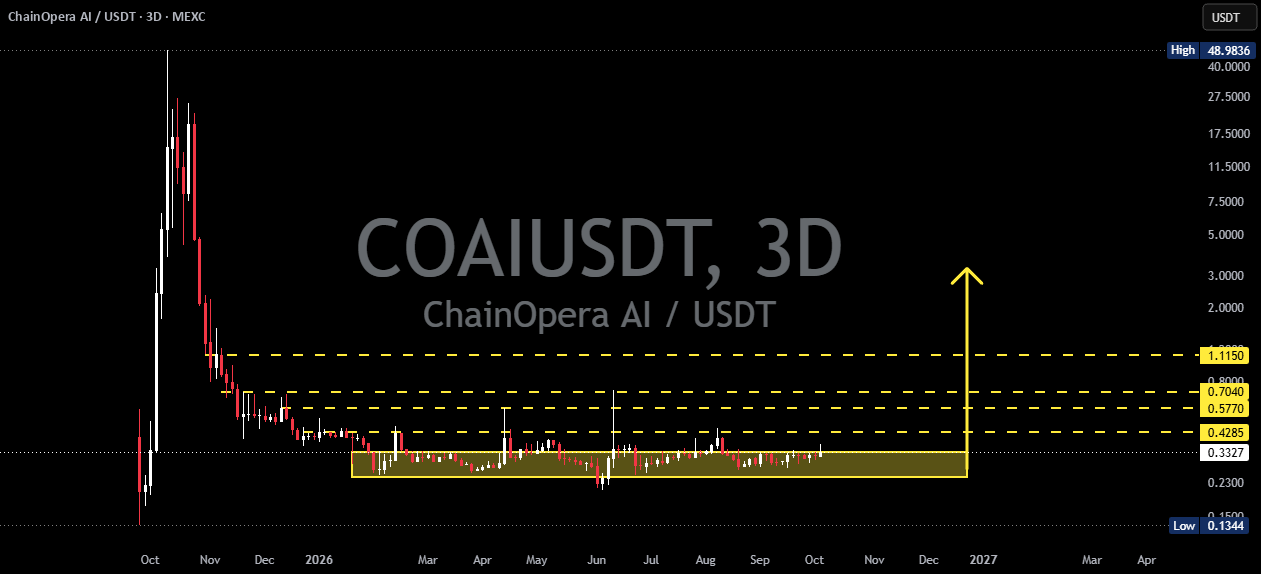
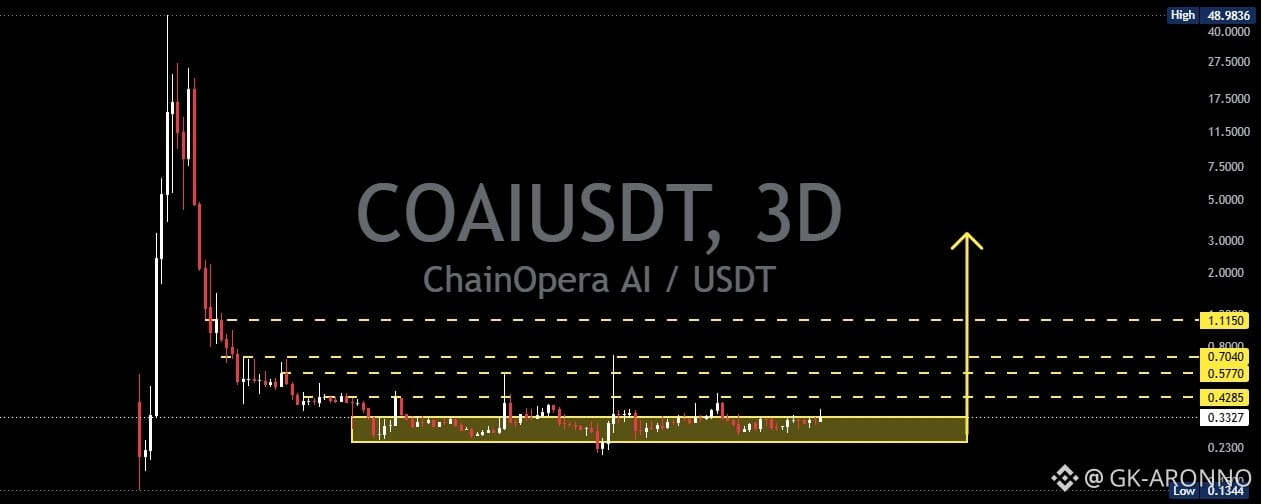
🟨 Major Accumulation/Support Zone: $0.245 – $0.3325
---
🔍 📐 Pattern Overview
The COAI/USDT chart shows that price has experienced a long-term downtrend after reaching a historical high around $48.98.
Following this extreme decline, price entered a long consolidation phase that has lasted for several months, with price trading within a relatively defined range.
🟨 The $0.245 – $0.3325 zone is particularly important because price has repeatedly held and consolidated within this area.
📌 This structure can be interpreted as a Base / Accumulation Range, which could potentially become the foundation for a reversal if price breaks out with strong momentum and volume.
⚠️ However, the accumulation structure should not yet be considered fully confirmed until price successfully breaks above the key resistance levels.
---
🟢 BULLISH SCENARIO
🚀 The bullish scenario becomes significantly stronger if COAI breaks out of the consolidation phase and successfully moves above the key resistance levels.
🎯 Resistance & Targets
🥇 $0.4285
➡️ First major resistance and initial breakout level.
➡️ A confirmed breakout above this level could signal that price is beginning to move out of the accumulation base.
🥈 $0.5770
➡️ The next important resistance level.
➡️ If $0.4285 is broken and successfully holds as support, price could potentially move toward this area.
🥉 $0.7040
➡️ The next major resistance and an important psychological level.
➡️ A breakout above this level would further strengthen the bullish structure.
🔥 $1.1150
➡️ The main target shown on the chart.
➡️ If COAI breaks above $0.7040 with strong momentum, the $1.1150 area becomes the next major bullish target.
🚀 Extended Bullish Scenario:
If price successfully breaks above $1.1150 and confirms a successful retest, the medium-term structure could become significantly more bullish, potentially opening the way toward higher resistance levels.
---
📈 Bullish Confirmation to Watch
✅ Breakout above $0.4285
✅ 3D candle closes above resistance
✅ Increasing volume during the breakout
✅ Successful retest of resistance as support
✅ Formation of Higher Highs & Higher Lows
✅ Continued momentum toward $0.5770 → $0.7040 → $1.1150
🔥 The stronger the breakout and volume confirmation, the more convincing the potential reversal from the long-term accumulation phase becomes.
---
🔴 BEARISH SCENARIO
⚠️ The bullish scenario is not confirmed yet as long as COAI remains below the major resistance levels.
If price fails to break above $0.4285 and gets rejected, COAI could return to sideways trading within the existing range.
🔻 $0.3325
➡️ Near-term support and the upper boundary of the yellow zone.
🔻 $0.2450
➡️ Lower support and a critical boundary of the accumulation zone.
🚨 If price loses $0.2450 with a strong 3D candle close, the current base/accumulation structure could experience a breakdown.
Under this scenario, the bullish setup would weaken significantly and price could potentially search for a new support area at lower levels.
---
🟨 KEY YELLOW ZONE
🟨 $0.2450 – $0.3325
This is the most important area within the current chart structure.
📌 As long as price continues to hold above or within this zone, the possibility of a long-term base formation remains valid.
💡 In other words:
$0.2450 = Support / Invalidation Area
$0.3325 = Upper Range
$0.4285 = Breakout Confirmation
$0.5770 = Target 1
$0.7040 = Target 2
$1.1150 = Target 3
---
🧠 CONCLUSION
📊 COAI is currently in a very interesting phase following a prolonged consolidation period.
🟨 The price structure suggests a potential long-term accumulation/base formation between $0.2450 – $0.3325.
🚀 Bullish confirmation: A strong breakout and close above $0.4285.
🎯 If the breakout is successfully confirmed, the next levels to watch are:
$0.5770 → $0.7040 → $1.1150
🔴 On the other hand, if price fails to maintain the $0.2450 – $0.3325 zone, especially with a breakdown below $0.2450, the bullish setup could become invalid and bearish risk would increase.
⚠️ A breakout is not confirmed simply because price is approaching resistance. Wait for a candle close and retest for stronger confirmation.
---
📌 TradingView Summary
📊 Pattern: Long-Term Accumulation / Base Formation
🟨 Key Support: $0.2450 – $0.3325
🚧 Breakout Level: $0.4285
🎯 Target 1: $0.5770
🎯 Target 2: $0.7040
🎯 Target 3: $1.1150
🟢 Bullish: Break & Hold Above $0.4285
🔴 Bearish: Breakdown Below $0.2450
📈 Bias: Bullish Potential, Conditional on Breakout Confirmation