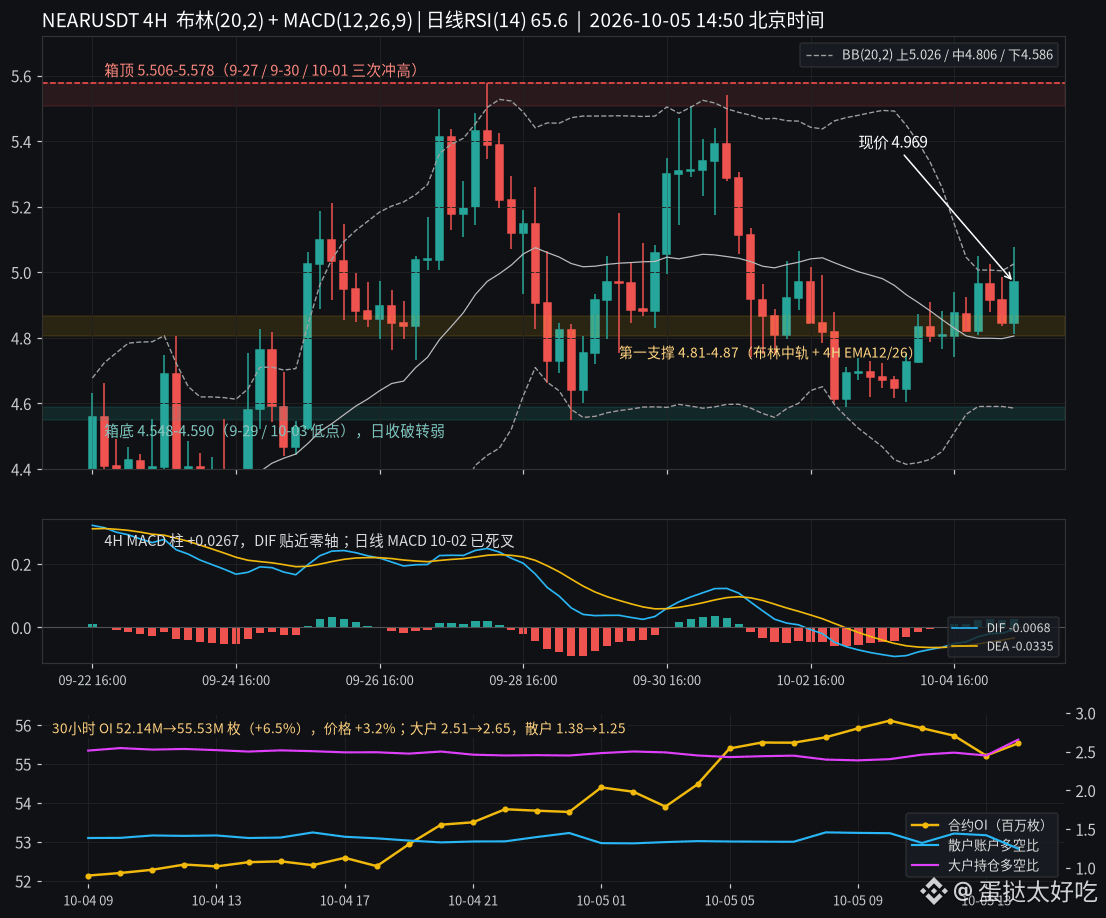
$NEAR -day MACD on October 2 just formed a death cross; today is Day 4. Yet the price has actually risen from 4.69 to 4.97. I don’t think this is a top—more like a high-volume breakout with declining volume and turnover after a 2.6x surge.
Starting from 1.54 in mid-August, it touched 5.578 on September 27. After that, for ten days it stayed in a range of 4.55–5.58. It tried to break above 5.5 three times but failed to hold; twice it pulled back to 4.55–4.59, but support was maintained. Daily trading volume averaged 43.64 million shares from 9/27 to 10/01, then shrank to 15.34 million and 16.75 million on 10/03 and 10/04—down to just over 30%.
Daily MACD (12,26,9): DIF 0.595, DEA 0.651, histogram -0.056. The histogram is still getting longer—price is moving sideways while the moving averages are catching up, causing lag. Daily RSI (14) fell from 76.0 on September 30 to 65.6. The overbought condition has been digested over time, not by smashing the price.
4H MACD histogram turned from -0.006 to +0.027; DIF -0.0068 is clinging to the zero line. 4H Bollinger Bands (20,2): middle band 4.806, upper band 5.026, lower band 4.586. %B is 0.87 and bandwidth is 9.15%, which—within the latest 180 4H candles—is among the narrowest 2%.
For the 30-hour contracts, OI (open interest) increased from 52.14 million to 55.53 million (+6.5%), but the price only rose 3.2%. The large-holder long/short ratio went from 2.51 to 2.65, while the retail account long/short ratio went from 1.38 to 1.25. The funding rate has stayed at a 0.01% benchmark. Large holders are adding; retail is reducing—doesn’t look like retail is chasing higher prices.
First, support to watch is 4.81–4.87. Then the 4H Bollinger middle band plus the 12/26 EMAs (4.862/4.868). Below that is the daily EMA12 at 4.74. If the daily candle closes below 4.548, then the box/range can be considered broken. On the upside, if a 4H candle closes above 5.03, then we’ll look at 5.21, and next the top of the 5.5–5.58 range.
My bias is that after the Bollinger bands tighten and contract, the direction selects upward—first aiming at 5.2. But after a 2.6x surge, that kind of distribution often looks the same. Do you think this is accumulation ahead of the second wave, or is it the “first exit” during altcoin rotation?
#NEAR #altcoin
Starting from 1.54 in mid-August, it touched 5.578 on September 27. After that, for ten days it stayed in a range of 4.55–5.58. It tried to break above 5.5 three times but failed to hold; twice it pulled back to 4.55–4.59, but support was maintained. Daily trading volume averaged 43.64 million shares from 9/27 to 10/01, then shrank to 15.34 million and 16.75 million on 10/03 and 10/04—down to just over 30%.
Daily MACD (12,26,9): DIF 0.595, DEA 0.651, histogram -0.056. The histogram is still getting longer—price is moving sideways while the moving averages are catching up, causing lag. Daily RSI (14) fell from 76.0 on September 30 to 65.6. The overbought condition has been digested over time, not by smashing the price.
4H MACD histogram turned from -0.006 to +0.027; DIF -0.0068 is clinging to the zero line. 4H Bollinger Bands (20,2): middle band 4.806, upper band 5.026, lower band 4.586. %B is 0.87 and bandwidth is 9.15%, which—within the latest 180 4H candles—is among the narrowest 2%.
For the 30-hour contracts, OI (open interest) increased from 52.14 million to 55.53 million (+6.5%), but the price only rose 3.2%. The large-holder long/short ratio went from 2.51 to 2.65, while the retail account long/short ratio went from 1.38 to 1.25. The funding rate has stayed at a 0.01% benchmark. Large holders are adding; retail is reducing—doesn’t look like retail is chasing higher prices.
First, support to watch is 4.81–4.87. Then the 4H Bollinger middle band plus the 12/26 EMAs (4.862/4.868). Below that is the daily EMA12 at 4.74. If the daily candle closes below 4.548, then the box/range can be considered broken. On the upside, if a 4H candle closes above 5.03, then we’ll look at 5.21, and next the top of the 5.5–5.58 range.
My bias is that after the Bollinger bands tighten and contract, the direction selects upward—first aiming at 5.2. But after a 2.6x surge, that kind of distribution often looks the same. Do you think this is accumulation ahead of the second wave, or is it the “first exit” during altcoin rotation?
#NEAR #altcoin