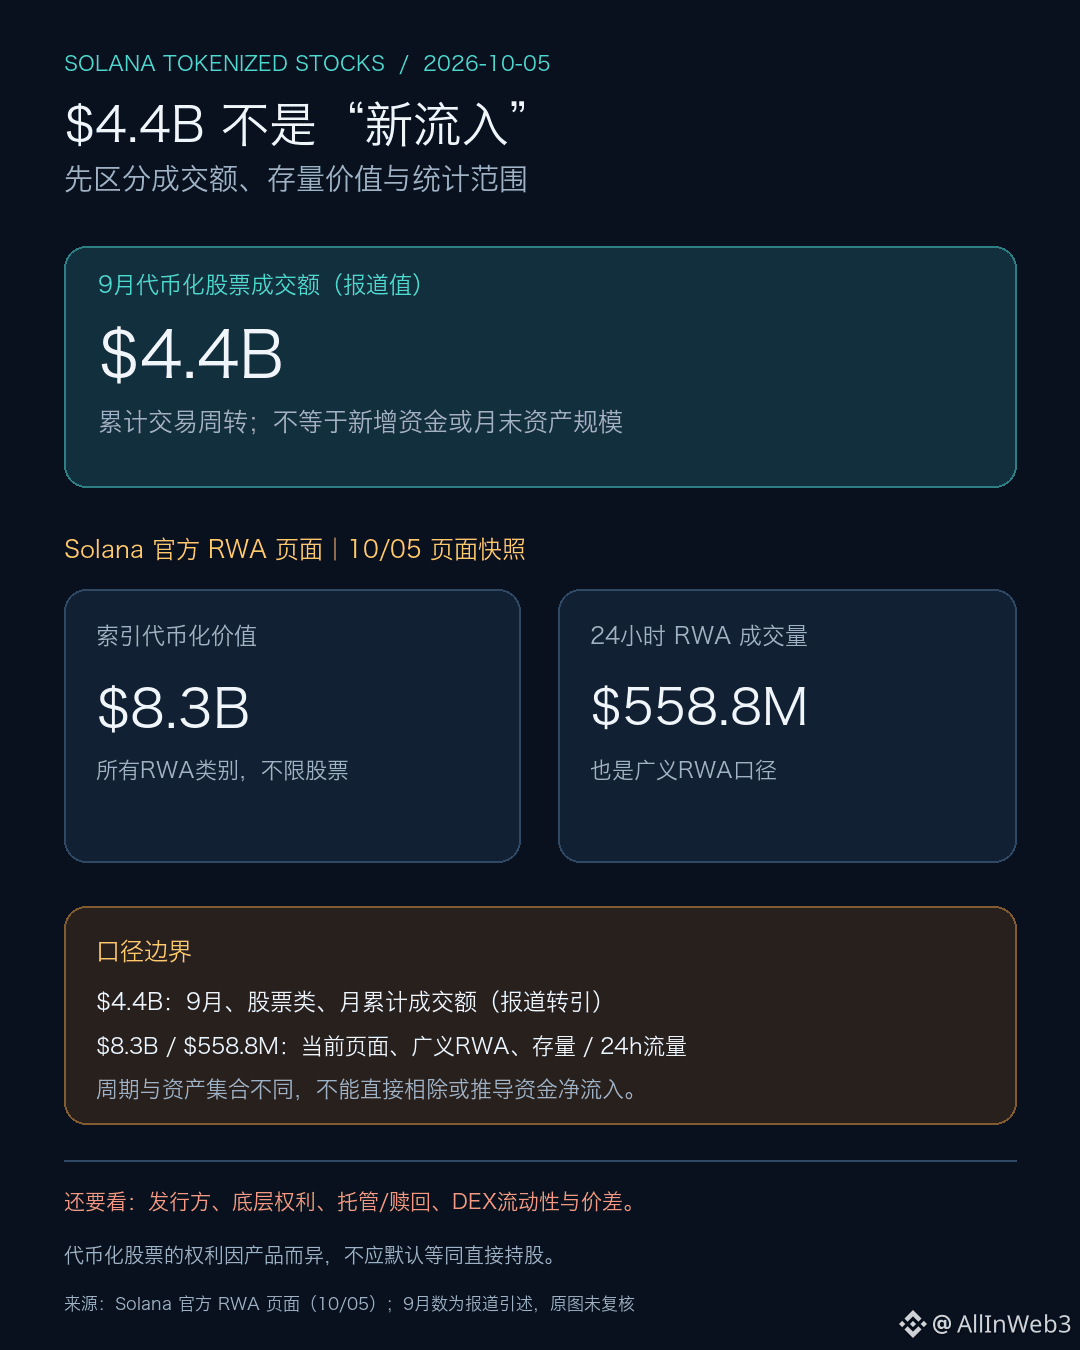
$4.4B 的 headline is eye-catching, but before reading it, first distinguish between “trading volume” and “asset holdings.” Recent reporting said that the Solana tokenized stock DEX in September had trading volume of about $4.4 billion, attributing the figure to Blockworks’ statistics and a repost by Solana’s official account. In this round, we did not directly verify the original post’s accompanying charts and full definitions, so we treat it as a “reported value” and do not claim a higher level of precision.
This is neither new money inflow of $4.4 billion nor the on-chain stock market cap at the end of September. Trading volume accumulates buy-sell turnover; the same capital repeatedly traded will be counted multiple times. Holding value, by contrast, reflects the size of holdings at a specific point in time. Solana’s official RWA page shows, on October 5: indexed tokenized value of about $8.3 billion, with a 24-hour RWA trading volume of about $558.8 million. However, it covers a broader set of real-world asset categories—nothing limited to stocks—and the time windows are different: one is for holdings and the other is for a single day. They cannot be directly divided against September’s stock trading volume, nor can they be combined to form a growth rate.
Therefore, $4.4B is more suitable as a clue to activity. To judge whether the market is getting “thicker,” you also need to look at the tokenized stock’s end-of-month holdings, the number of independent holders, bid-ask spreads, and trading volumes during stress periods. Another boundary concerns product rights: some tokens represent the economic exposure arranged by the issuer, and do not necessarily equal direct ownership of the underlying listed company shares. The issuer, custodian, redemption terms, and the trading venue must each be verified one by one.
You also need to clarify timing: the topic was reshared on October 4, which does not mean the data was generated on October 4—it is counting the entire month of September. The official RWA page is a dynamic snapshot dated October 5, so you cannot subtract the two and treat it as “growth on October.” If you compare trends afterward, you should use the same data source, the same set of stock assets, September/October trading volumes, and combine that with end-of-month representational value, issuer concentration, and platform concentration. Only if trading volume stays steady while spreads narrow and depth improves can it more convincingly indicate that liquidity is usable. If only a few days see a surge in volume, it may simply reflect high turnover; you cannot conclude that holders are broader based on trading volume alone. Statistical transparency, product rights, and tradable liquidity still need to be checked separately. #Solana
This is neither new money inflow of $4.4 billion nor the on-chain stock market cap at the end of September. Trading volume accumulates buy-sell turnover; the same capital repeatedly traded will be counted multiple times. Holding value, by contrast, reflects the size of holdings at a specific point in time. Solana’s official RWA page shows, on October 5: indexed tokenized value of about $8.3 billion, with a 24-hour RWA trading volume of about $558.8 million. However, it covers a broader set of real-world asset categories—nothing limited to stocks—and the time windows are different: one is for holdings and the other is for a single day. They cannot be directly divided against September’s stock trading volume, nor can they be combined to form a growth rate.
Therefore, $4.4B is more suitable as a clue to activity. To judge whether the market is getting “thicker,” you also need to look at the tokenized stock’s end-of-month holdings, the number of independent holders, bid-ask spreads, and trading volumes during stress periods. Another boundary concerns product rights: some tokens represent the economic exposure arranged by the issuer, and do not necessarily equal direct ownership of the underlying listed company shares. The issuer, custodian, redemption terms, and the trading venue must each be verified one by one.
You also need to clarify timing: the topic was reshared on October 4, which does not mean the data was generated on October 4—it is counting the entire month of September. The official RWA page is a dynamic snapshot dated October 5, so you cannot subtract the two and treat it as “growth on October.” If you compare trends afterward, you should use the same data source, the same set of stock assets, September/October trading volumes, and combine that with end-of-month representational value, issuer concentration, and platform concentration. Only if trading volume stays steady while spreads narrow and depth improves can it more convincingly indicate that liquidity is usable. If only a few days see a surge in volume, it may simply reflect high turnover; you cannot conclude that holders are broader based on trading volume alone. Statistical transparency, product rights, and tradable liquidity still need to be checked separately. #Solana