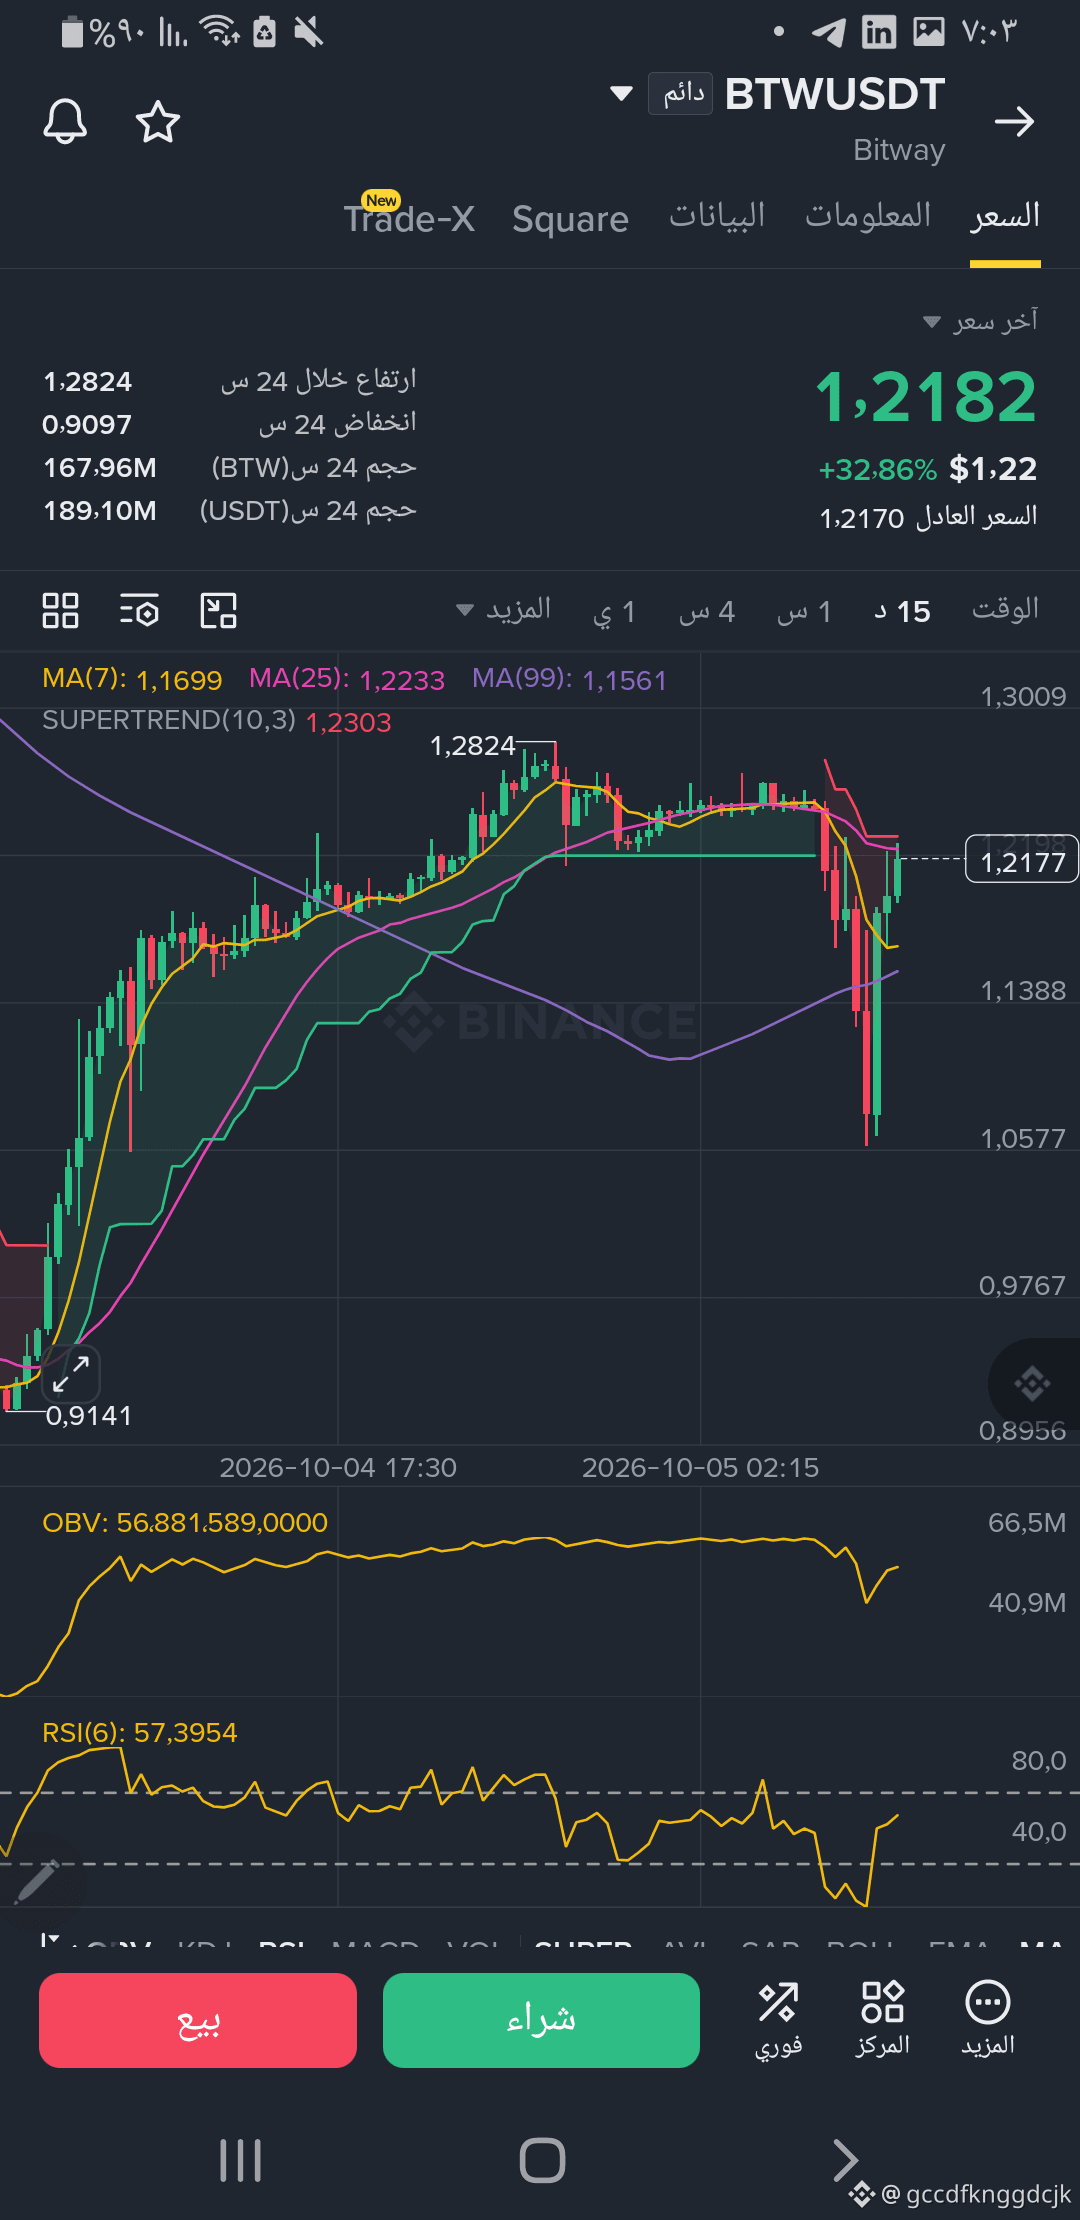
$BTW 🔻 Sharp fluctuation and an attempt to rebound for the BTW (Bitway) coin!
The BTW coin witnessed a sharp corrective move that led to a rapid drop toward the 1.0577 USDT low before rebounding strongly and currently trading at 1.2182 USDT (with its rise still +32.86% over the last 24 hours).
📉 Technical Read (15-minute timeframe):
RSI Indicator: It is at balanced levels of 57.39 after recovering from the extreme oversold zone it reached during the rapid decline.
Moving Averages: The price has managed to return and trade above the MA7 (1.1699) and MA99 (1.1561) moving averages, while facing resistance near the MA25 (1.2233).
SuperTrend Indicator: The line above is at 1.2303 USDT.
🎯 Key Levels:
🟢 Near Support: 1.1700 - 1.1560 USDT.
🔴 Resistance: 1.2230 - 1.2300 USDT (breaking through and holding above it opens the door for a return toward the peak at 1.2824 USDT).
💡 Summary: The long lower tail of the last bearish candle indicates rebound buying strength, but it is preferable to wait for a close and confirmation above the resistance zone (1.2300 USDT) to validate the continuation of the upward trend.
⚠️ Disclaimer: This post is for technical analysis and educational purposes only and is not financial advice.
The BTW coin witnessed a sharp corrective move that led to a rapid drop toward the 1.0577 USDT low before rebounding strongly and currently trading at 1.2182 USDT (with its rise still +32.86% over the last 24 hours).
📉 Technical Read (15-minute timeframe):
RSI Indicator: It is at balanced levels of 57.39 after recovering from the extreme oversold zone it reached during the rapid decline.
Moving Averages: The price has managed to return and trade above the MA7 (1.1699) and MA99 (1.1561) moving averages, while facing resistance near the MA25 (1.2233).
SuperTrend Indicator: The line above is at 1.2303 USDT.
🎯 Key Levels:
🟢 Near Support: 1.1700 - 1.1560 USDT.
🔴 Resistance: 1.2230 - 1.2300 USDT (breaking through and holding above it opens the door for a return toward the peak at 1.2824 USDT).
💡 Summary: The long lower tail of the last bearish candle indicates rebound buying strength, but it is preferable to wait for a close and confirmation above the resistance zone (1.2300 USDT) to validate the continuation of the upward trend.
⚠️ Disclaimer: This post is for technical analysis and educational purposes only and is not financial advice.