$NIL
📊 Breakdown of NIL/USDT chart: Professional technical view (2 scenarios and targets)
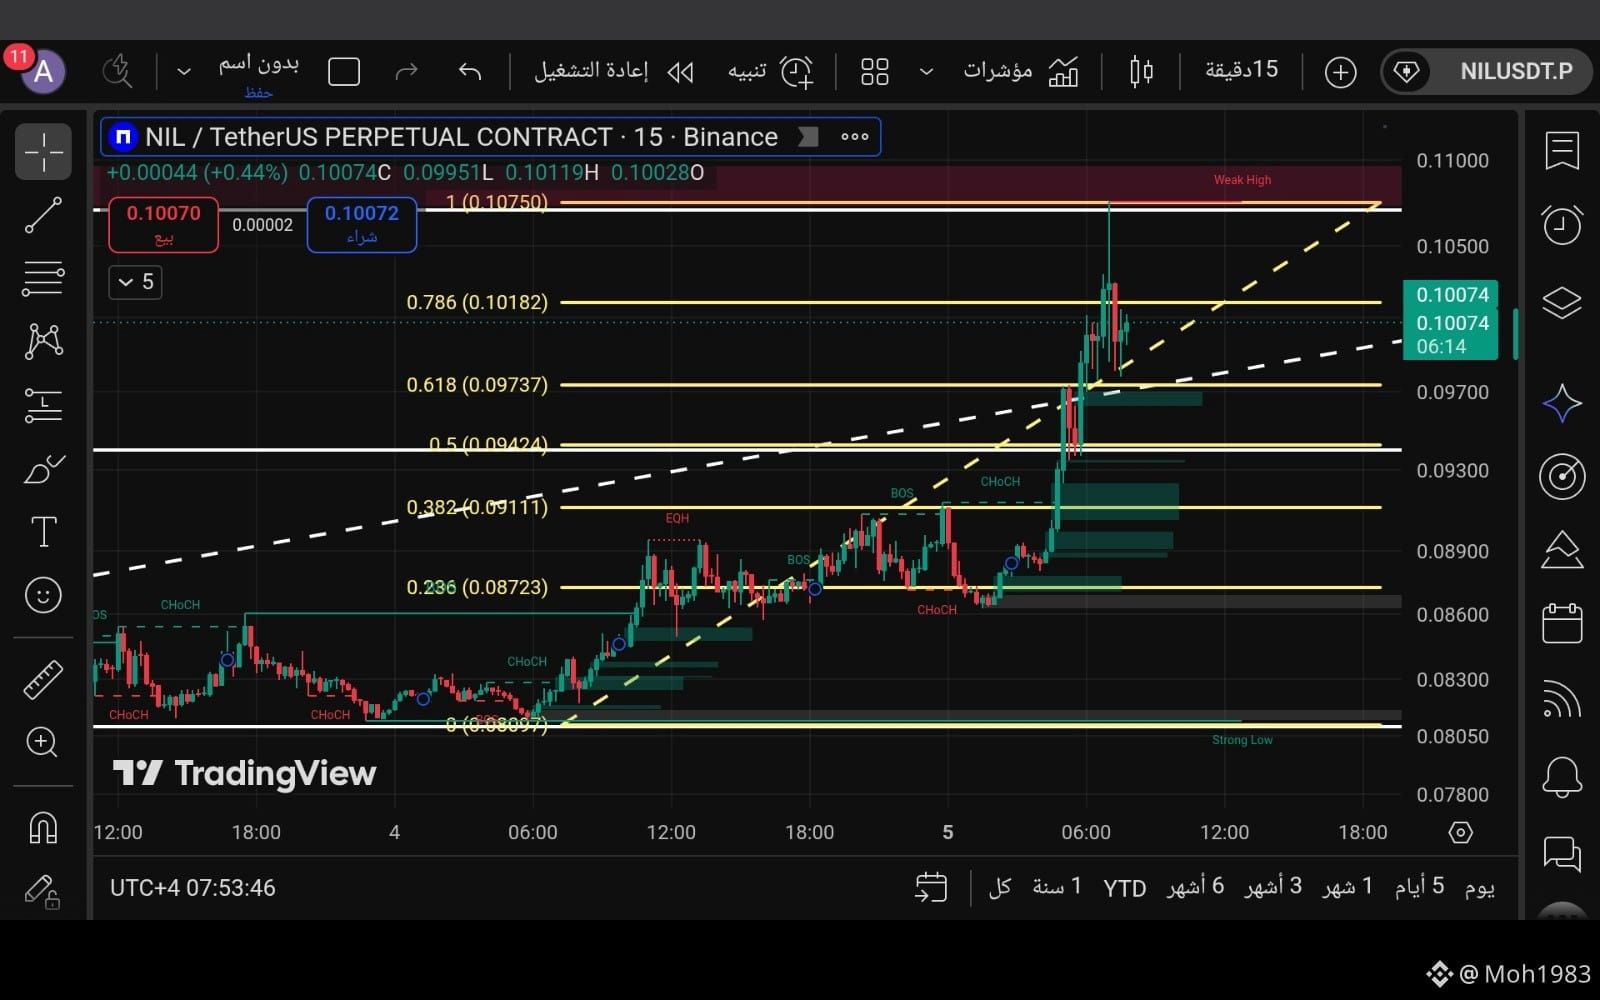
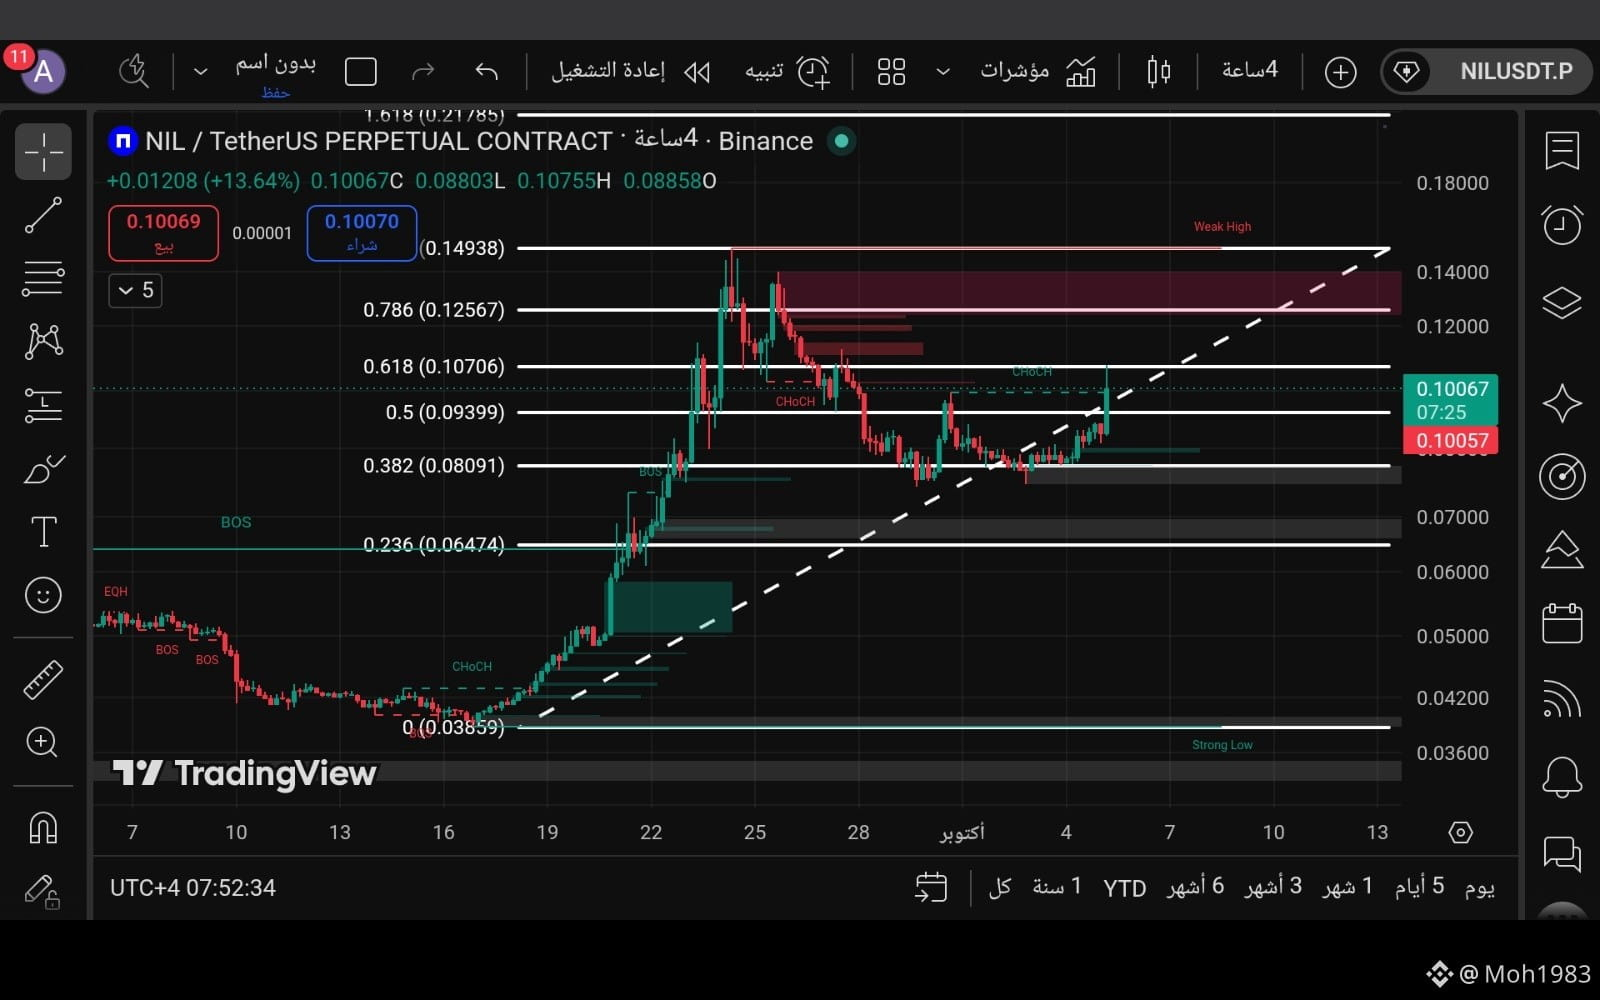
After the strong breakout of the structural move from the bottom at 0.08097 up to the current levels around 0.1007 on the 15-minute and 4-hour timeframes, the price is testing key turning points. Let’s read the chart with awareness and identify the consolidation zones:
🎯 Best buy and watch zones:
* First zone (light correction): at levels 0.0973, the first possible stop where the price may head to calm the indicators.
* Golden zone (support for re-centering): between levels 0.0911 and 0.0942 — this is the best area to watch and enter gradually if a corrective drop occurs.
* Stop loss: a break and closing a candle below the 0.0872 levels would invalidate the direct bullish structure.
🔄 First scenario (Bullish — higher probability):
Price holds steady and respects the current support areas, or experiences a calm dip to test the 0.0973 zone, then rebounds from it targeting continuation of the upward momentum:
* 🎯 First target: 0.1075 (testing the last high)
* 🎯 Second target: 0.1150
* 🎯 Third target: 0.1256 (advanced levels based on the move’s extension on the 4-hour timeframe)
⚠️ Second scenario (deeper correction):
If selling pressure increases and the price breaks the first support zones, the price will head toward re-testing the lower accumulation area between 0.0911 and 0.0942 to flush out overbought conditions and build new liquidity before resuming the trend.
📊 Breakdown of NIL/USDT chart: Professional technical view (2 scenarios and targets)
After the strong breakout of the structural move from the bottom at 0.08097 up to the current levels around 0.1007 on the 15-minute and 4-hour timeframes, the price is testing key turning points. Let’s read the chart with awareness and identify the consolidation zones:
🎯 Best buy and watch zones:
* First zone (light correction): at levels 0.0973, the first possible stop where the price may head to calm the indicators.
* Golden zone (support for re-centering): between levels 0.0911 and 0.0942 — this is the best area to watch and enter gradually if a corrective drop occurs.
* Stop loss: a break and closing a candle below the 0.0872 levels would invalidate the direct bullish structure.
🔄 First scenario (Bullish — higher probability):
Price holds steady and respects the current support areas, or experiences a calm dip to test the 0.0973 zone, then rebounds from it targeting continuation of the upward momentum:
* 🎯 First target: 0.1075 (testing the last high)
* 🎯 Second target: 0.1150
* 🎯 Third target: 0.1256 (advanced levels based on the move’s extension on the 4-hour timeframe)
⚠️ Second scenario (deeper correction):
If selling pressure increases and the price breaks the first support zones, the price will head toward re-testing the lower accumulation area between 0.0911 and 0.0942 to flush out overbought conditions and build new liquidity before resuming the trend.