$BTC 24-hour up 1.7%, $ADA up 11%, and $SOL nearly flat. What’s even more awkward is that the price didn’t move, yet open interest on the contracts actually increased by nearly 4%. Many people call this “building up power then catching up with a surge,” but I think it’s more like the longs are piling positions into a level the market can’t push through.
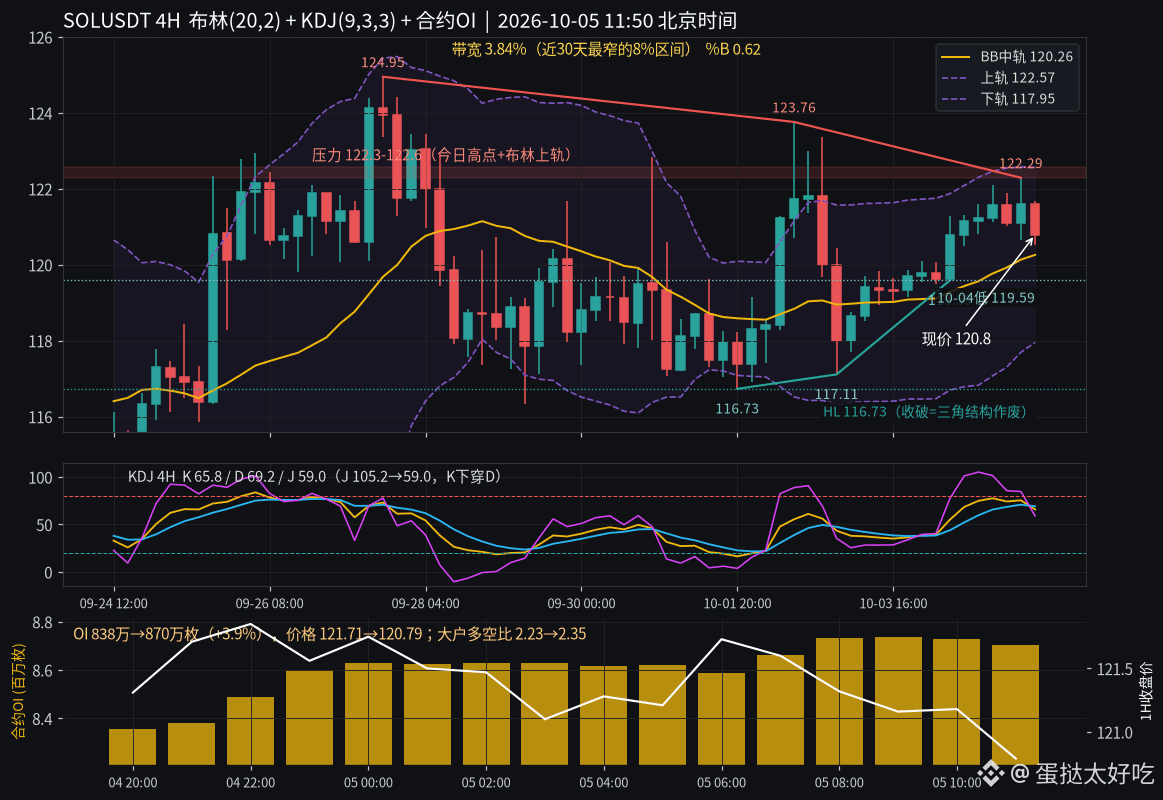
From 9:00 PM last night to 11:00 AM today, SOL contract OI rose from 8.38M to 8.70M (+3.9%). Over the same period, the 1H closing price fell from 121.71 to 120.79. The big players’ long/short ratio went from 2.23 to 2.35, while retail accounts went from 1.60 to 1.65—both sides are adding longs. Funding rates were all at the 0.01% benchmark for the last three periods, and the next period is estimated at 0.0064%. SOL/BTC dropped from 0.001452 on September 25 to 0.001400, underperforming BTC by about 3.6% over ten days.
4H Bollinger Bands (20,2): mid 120.26, upper 122.57, lower 117.95; %B 0.62; bandwidth 3.84%, landing in the narrowest 8% range over the past 30 days. 4H KDJ (9,3,3): K 65.8, D 69.2, J 59.0. J has slid steadily from 105.2 at 16:00 yesterday; K has just crossed below D. Daily MACD (12,26,9): DIF 4.81, DEA 5.24, histogram -0.42. After the dead cross on October 1, the green histogram hasn’t shrunk; today’s daily bar only just turned into a 4-hour timeframe, and the numbers can still change.
Daily swing highs: 124.95 on Sep 27, 123.76 on Oct 2, and 122.29 in the early hours today—each one lower than the last. Swing lows: 116.73 on Oct 1, 117.11 on Oct 3, 119.59 on Oct 4—each one higher than the last. Converging triangle: the tip is squeezed into 122.3–122.6 (today’s high overlaps the Bollinger upper band). Only if it stands above and holds can we look at 123.76 and 124.95. If it breaks below 119.6, first target is 117.95; if it breaks and closes below 116.73, then this higher-lows structure is invalidated.
With bandwidth this tight, the direction won’t be small. The more positions are stacked and the more the price fails to hold above 122, the more I lean toward a sweep downward first to 119.6. Do you think SOL is waiting to “catch up on the pull-up,” or waiting for a long squeeze/capitulation?
#SOL #技术分析 #contract data
From 9:00 PM last night to 11:00 AM today, SOL contract OI rose from 8.38M to 8.70M (+3.9%). Over the same period, the 1H closing price fell from 121.71 to 120.79. The big players’ long/short ratio went from 2.23 to 2.35, while retail accounts went from 1.60 to 1.65—both sides are adding longs. Funding rates were all at the 0.01% benchmark for the last three periods, and the next period is estimated at 0.0064%. SOL/BTC dropped from 0.001452 on September 25 to 0.001400, underperforming BTC by about 3.6% over ten days.
4H Bollinger Bands (20,2): mid 120.26, upper 122.57, lower 117.95; %B 0.62; bandwidth 3.84%, landing in the narrowest 8% range over the past 30 days. 4H KDJ (9,3,3): K 65.8, D 69.2, J 59.0. J has slid steadily from 105.2 at 16:00 yesterday; K has just crossed below D. Daily MACD (12,26,9): DIF 4.81, DEA 5.24, histogram -0.42. After the dead cross on October 1, the green histogram hasn’t shrunk; today’s daily bar only just turned into a 4-hour timeframe, and the numbers can still change.
Daily swing highs: 124.95 on Sep 27, 123.76 on Oct 2, and 122.29 in the early hours today—each one lower than the last. Swing lows: 116.73 on Oct 1, 117.11 on Oct 3, 119.59 on Oct 4—each one higher than the last. Converging triangle: the tip is squeezed into 122.3–122.6 (today’s high overlaps the Bollinger upper band). Only if it stands above and holds can we look at 123.76 and 124.95. If it breaks below 119.6, first target is 117.95; if it breaks and closes below 116.73, then this higher-lows structure is invalidated.
With bandwidth this tight, the direction won’t be small. The more positions are stacked and the more the price fails to hold above 122, the more I lean toward a sweep downward first to 119.6. Do you think SOL is waiting to “catch up on the pull-up,” or waiting for a long squeeze/capitulation?
#SOL #技术分析 #contract data