
$SOL : A DISPUTE BETWEEN US$ 124 AND US$ 125 CAN DETERMINE THE NEXT MOVE
Solana starts October in a region that deserves attention. After gaining about 41.5% in August and a further 14.6% in September, the asset is approaching again a resistance that has been limiting its progress.
The question now is not just whether SOL can go up. It is to understand whether there is enough strength to turn a technical barrier into a new support zone.
THE TECHNICAL PANEL
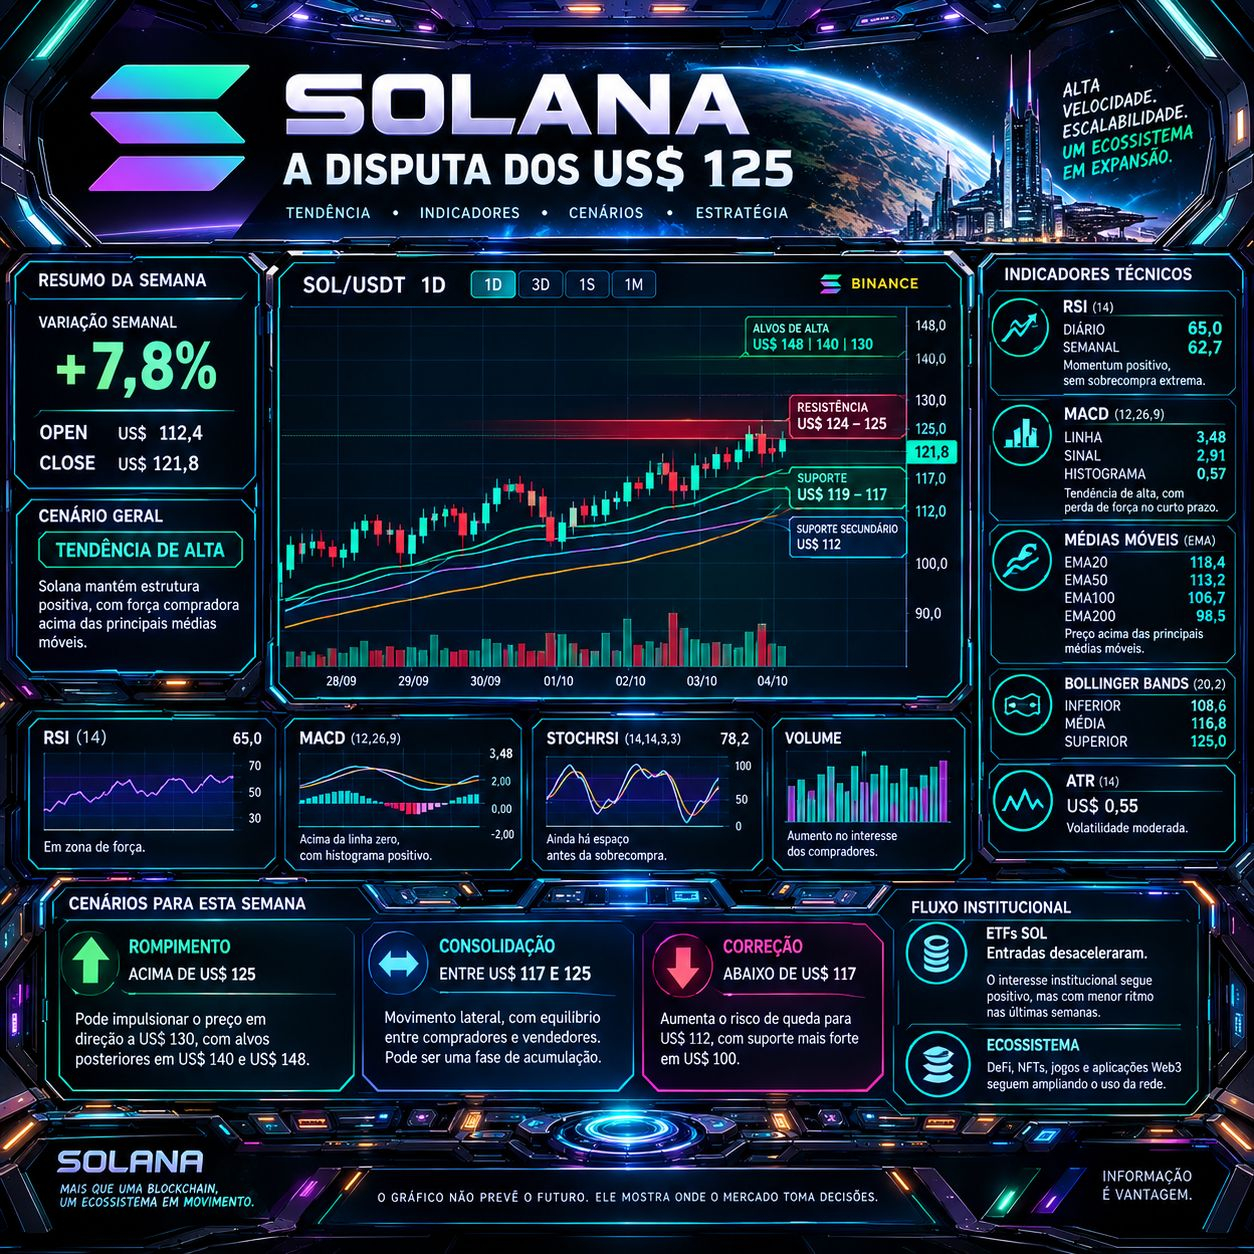
With Solana trading in the US$ 121–122 region, daily indicators point to a predominantly bullish structure.
Daily RSI: approximately 65. Momentum is favorable, but it is approaching an area where buying pressure may begin to lose steam.
Moving averages: the 20-, 50-, 100-, and 200-period averages are below the price, forming a constructive setup.
MACD: remains positive in the daily readings reviewed, reinforcing the short-term trend.
Volatility: an ATR near $0.55 in the intraday readings shows that rapid moves can occur even within a relatively narrow range.
The technical picture is positive, but it does not guarantee that the trend will continue. Indicators can change quickly, especially in a market sensitive to Bitcoin’s behavior.
SCENARIO 1 — BREAKOUT
A sustained daily close above $124–125, accompanied by volume, would strengthen the case for the uptrend to continue. In that scenario, the $130 area could come into focus, with $140 and $148 as subsequent reference points—not guaranteed targets.
SCENARIO 2 — CONSOLIDATION
As long as SOL remains between approximately $117 and $125, the market may continue to absorb its recent gains. A period of sideways trading does not necessarily signal weakness: it may reflect a tug-of-war between profit-taking and new buyers entering the market.
SCENARIO 3 — CORRECTION
Losing the $119–117 area on significant closes would weaken the short-term structure. Below this range, $112 is the next support reference. The price reaction and volume in this area will be just as important as a resistance breakout.
THE FACTOR YOU CAN’T SEE ON THE CHART ALONE
Ecosystem activity, technological progress, and institutional adoption are all part of Solana’s long-term thesis. But recent flows into U.S. SOL ETFs have slowed significantly: after a week with inflows of nearly $188 million, the following week saw only about $800,000 in net inflows.
This contrast deserves attention. A project may have meaningful fundamentals while its asset goes through periods of weaker financial demand.
WHAT REALLY MATTERS
Price, volume, liquidity, indicators, and capital flows need to be assessed together. A resistance breakout without buying participation may turn out to be a false move. Likewise, a correction within a broader trend does not, by itself, mean the long-term thesis is no longer valid.
The chart does not predict the future. It shows where the market is making decisions.
For Solana, the central question is straightforward: will $125 remain a ceiling, or could it turn into support?
The answer will depend less on expectations and more on confirmation from the next moves.
Information broadens perspective. Discipline protects capital.
.
.
#Solana #SOL #TechnicalAnalysis #Cryptocurrency #CryptoMarket #Trading #RSI #MACD #Blockchain #DeFi #Web3 #Crypto