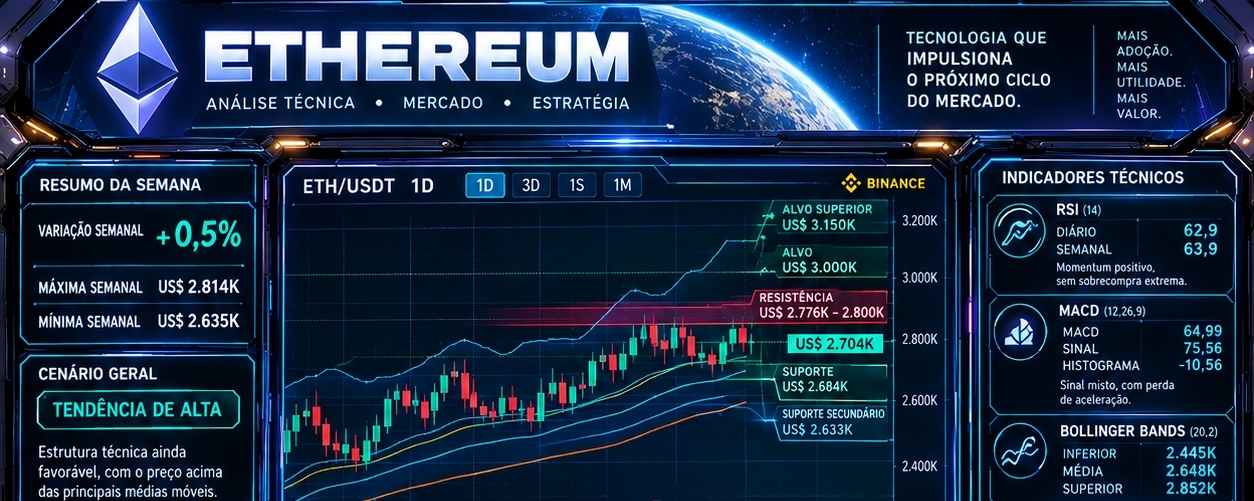

$ETH : THE NEXT DECISION LIES BETWEEN US$ 2,776 AND US$ 2,800
Ethereum enters October facing a setup that deserves attention. After an expressive rebound in August and September, the asset has moved back toward a region where the market needs to choose between the continuation of the uptrend or a new phase of consolidation.
ETH has managed to test the US$ 2,775–2,800 range, but it has not yet been able to establish that region as support. It is precisely this resistance that could determine the next relevant move.
THE TECHNICAL DASHBOARD
The daily structure remains constructive.
• Daily RSI: 62.9 — positive momentum, still below the traditional overbought zone.
• Weekly RSI: 63.9 — strength is also present over the broader time frame.
• Moving averages: ETH is above the 20-, 50-, 100- and 200-day averages, maintaining a favorable technical structure.
• Bollinger Bands: the middle band is near US$2,648, and the upper band is approximately US$2,852.
• MACD: remains in elevated territory, but the negative histogram shows a loss of acceleration. This is a momentum warning, not confirmation of a reversal.
• Stochastic: 55/49.5, indicating there is still room before reaching an extreme condition.
Taken together, the indicators point to a predominantly positive trend, but an increasingly important decision point is approaching.
SCENARIO 1 — BREAKOUT
A convincing daily close above US$2,776–2,800, accompanied by volume, would strengthen the case for continued upside. In that scenario, US$3,000 comes into view, with US$3,150 as a subsequent technical reference point.
SCENARIO 2 — CONSOLIDATION
Between approximately US$2,684 and US$2,800, Ethereum may continue moving sideways as buyers absorb the supply. In this scenario, time may matter as much as price.
SCENARIO 3 — CORRECTION
A daily close below US$2,684 would weaken the short-term structure. The next support is around US$2,633, while a deeper correction could reach a significant area near US$2,514.
WHAT REALLY MATTERS
This is not about trying to guess the next candle.
The market needs to be observed through the combined signals of price, volume, liquidity, momentum, moving averages, volatility and capital flows.
A resistance level broken on strong volume can turn into support. A lost support level can turn consolidation into a correction.
The chart does not predict the future. It shows where the market is making decisions.
For Ethereum, the key question right now is:
Will US$2,800 continue to act as a barrier, or will it finally become support?
The answer could determine the next phase of the recovery.
Information broadens your perspective. Discipline protects your capital.
#Ethereum #ETH #TechnicalAnalysis #Cryptocurrency #CryptoMarket #Trading #RSI #MACD #BollingerBands #DeFi #Web3 #Crypto