
**$AXS
Macro Update: Navigating the Multi-Year Bottom Range 🎮**
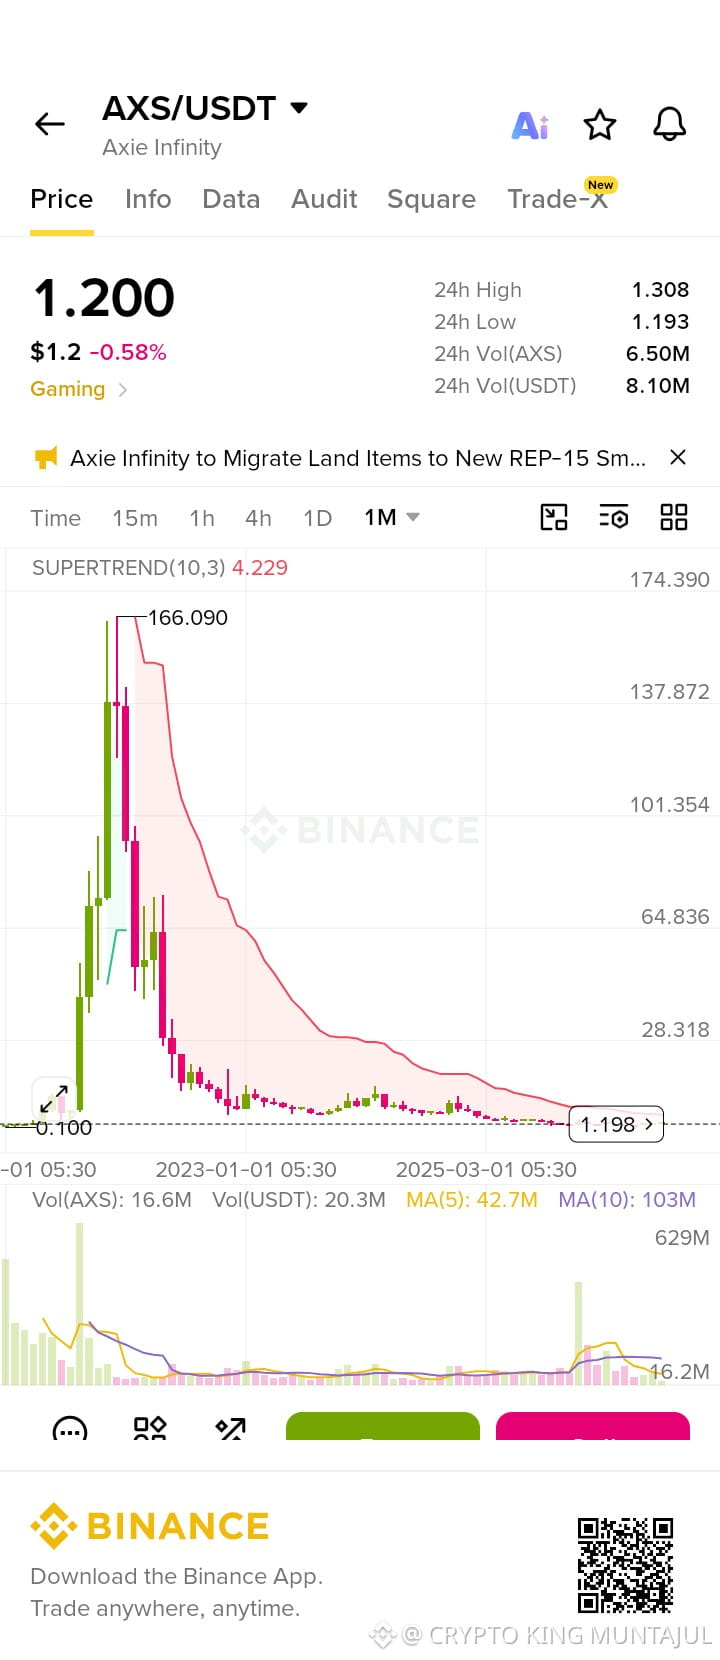
The **$AXS/USDT** 1M (Monthly) chart displays a long-term bottoming pattern following its historical peak of $166.090. Here is a technical overview:
* **Current Price Action:** $AXS is trading around **$1.200** (-0.58%), consolidating near its 24-hour low of **$1.193**.
* **Critical Support Zone:** Immediate baseline support sits near **$0.100**–**$1.193**. Holding above $1.193 is crucial to prevent further downside exploration.
* **Macro Resistance:** The Supertrend indicator (10,3) remains bearish overhead at **4.229**. Significant multi-year resistance levels sit at $4.229, followed by $28.318 and $64.836.
* **Volume Profile:** A slight increase in volume has been detected near current lower levels, signaling gradual accumulation after extended sell-off periods.
* **Ecosystem News Note:** Keep an eye on project updates regarding the migration of land items to the REP-15 smart contract infrastructure.
**Trading Setup:**
* **Bulls:** Accumulation strategies near the current base range ($1.193 support), aiming for a breakout toward the Supertrend dynamic resistance level near $4.229.
* **Bears:** Breakout below $1.193 could trigger a retest of lower historical lows.
Are you accumulating $AXS at these low levels for the long haul, or waiting for a structural reversal sign? Share your thoughts below! 👇
#AXS #AxieInfinity #CryptoAnalysis #BinanceSquare #Gaming #TechnicalAnalysis
Macro Update: Navigating the Multi-Year Bottom Range 🎮**
The **$AXS/USDT** 1M (Monthly) chart displays a long-term bottoming pattern following its historical peak of $166.090. Here is a technical overview:
* **Current Price Action:** $AXS is trading around **$1.200** (-0.58%), consolidating near its 24-hour low of **$1.193**.
* **Critical Support Zone:** Immediate baseline support sits near **$0.100**–**$1.193**. Holding above $1.193 is crucial to prevent further downside exploration.
* **Macro Resistance:** The Supertrend indicator (10,3) remains bearish overhead at **4.229**. Significant multi-year resistance levels sit at $4.229, followed by $28.318 and $64.836.
* **Volume Profile:** A slight increase in volume has been detected near current lower levels, signaling gradual accumulation after extended sell-off periods.
* **Ecosystem News Note:** Keep an eye on project updates regarding the migration of land items to the REP-15 smart contract infrastructure.
**Trading Setup:**
* **Bulls:** Accumulation strategies near the current base range ($1.193 support), aiming for a breakout toward the Supertrend dynamic resistance level near $4.229.
* **Bears:** Breakout below $1.193 could trigger a retest of lower historical lows.
Are you accumulating $AXS at these low levels for the long haul, or waiting for a structural reversal sign? Share your thoughts below! 👇
#AXS #AxieInfinity #CryptoAnalysis #BinanceSquare #Gaming #TechnicalAnalysis