$BTC
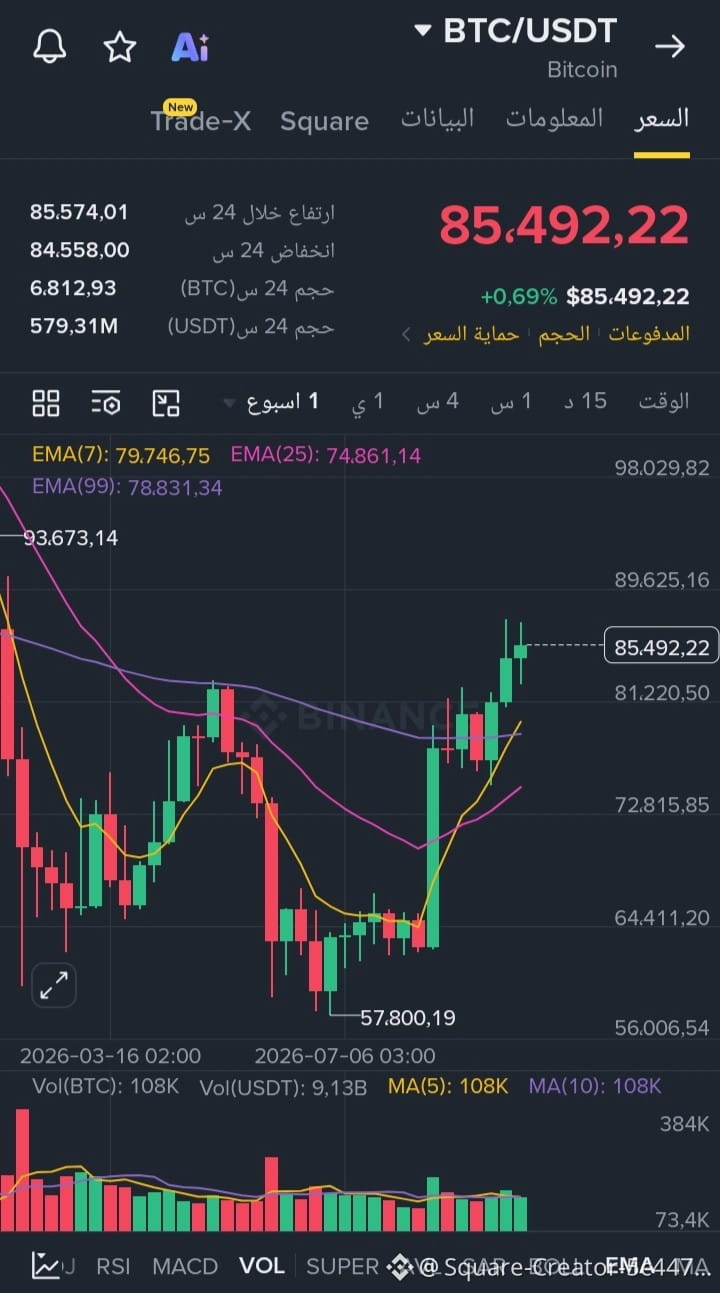
Here is a brief technical analysis of the BTC/USDT chart (on the weekly timeframe):
🚀Overall Trend: A strong bullish trend is currently prevailing, with the price trading at 85,492.22 above all moving averages (EMA 7, 25, 99).
💥Near Supports: The zone between 79,746 and 81,220 represents a strong dynamic support line (EMA 7) that should prevent any downside correction.
👍Next Resistance: The near-term upside target is close to the previous chart high at 89,625, followed by the 93,673 area.
🔥Conclusion: Positive momentum in favor of the buyer, along with rising trading volumes. As long as the price holds above 80,000, the positive outlook is more likely.
Here is a brief technical analysis of the BTC/USDT chart (on the weekly timeframe):
🚀Overall Trend: A strong bullish trend is currently prevailing, with the price trading at 85,492.22 above all moving averages (EMA 7, 25, 99).
💥Near Supports: The zone between 79,746 and 81,220 represents a strong dynamic support line (EMA 7) that should prevent any downside correction.
👍Next Resistance: The near-term upside target is close to the previous chart high at 89,625, followed by the 93,673 area.
🔥Conclusion: Positive momentum in favor of the buyer, along with rising trading volumes. As long as the price holds above 80,000, the positive outlook is more likely.