10.4 Chen Jie’s outlook for next week’s market
Last Friday’s non-farm payroll night showed an extreme whipsaw and liquidation trap: during the session, prices once surged to 4226, then the bears launched a cliff-like selloff, with a vertical plunge of over 100 points into the close, ultimately finishing at the extremely low level of 4139. Official reserves remained steady (+20.22 tons), but after the rally, gold ETF holdings once again turned to net outflows of -0.85 tons. It is clear that major funds used the non-farm bullish news as cover to cash out at high levels
On the weekly chart, after the rebound to the weekly Bollinger midline (4279) failed, a hanging-man bearish candle with a very long upper shadow formed. A medium- to long-term double-top pattern is emerging, and downside room has fully opened up
On Friday’s daily chart, after the surge to 4226, a large bearish candle with a real body was formed, completely engulfing the previous three days of rebound bullish candles, directly pressuring the daily Bollinger lower band (4113). The MACD green histogram expanded for the second time
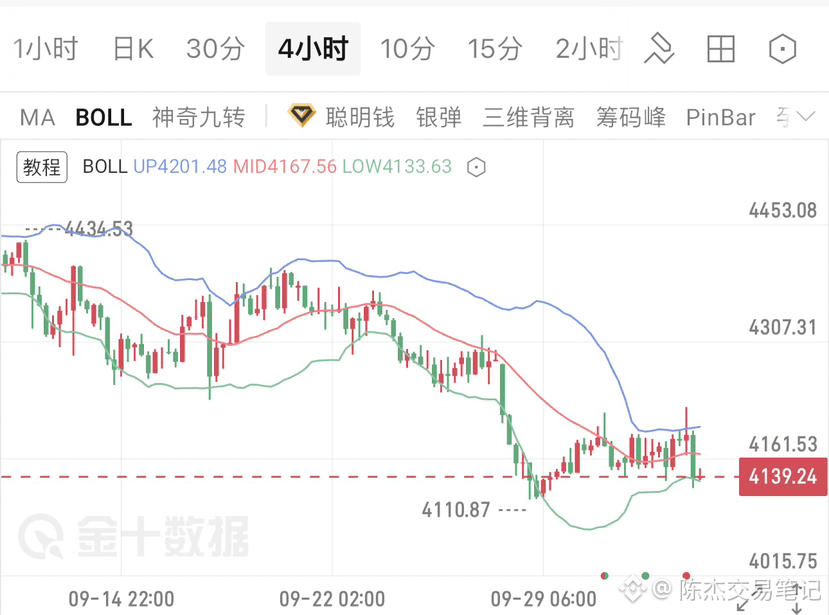
On the 4-hour chart, the Bollinger midline (4167) was decisively broken by the real body. The 12-hour Bollinger lower band points to 4074. Any short-term technical rebound will face strong resistance from the midlines of multiple timeframes
Trading strategy
Go short near 4165-4195, target 4115-4065-3965, stop loss 4238#xau $XAU
Last Friday’s non-farm payroll night showed an extreme whipsaw and liquidation trap: during the session, prices once surged to 4226, then the bears launched a cliff-like selloff, with a vertical plunge of over 100 points into the close, ultimately finishing at the extremely low level of 4139. Official reserves remained steady (+20.22 tons), but after the rally, gold ETF holdings once again turned to net outflows of -0.85 tons. It is clear that major funds used the non-farm bullish news as cover to cash out at high levels
On the weekly chart, after the rebound to the weekly Bollinger midline (4279) failed, a hanging-man bearish candle with a very long upper shadow formed. A medium- to long-term double-top pattern is emerging, and downside room has fully opened up
On Friday’s daily chart, after the surge to 4226, a large bearish candle with a real body was formed, completely engulfing the previous three days of rebound bullish candles, directly pressuring the daily Bollinger lower band (4113). The MACD green histogram expanded for the second time
On the 4-hour chart, the Bollinger midline (4167) was decisively broken by the real body. The 12-hour Bollinger lower band points to 4074. Any short-term technical rebound will face strong resistance from the midlines of multiple timeframes
Trading strategy
Go short near 4165-4195, target 4115-4065-3965, stop loss 4238#xau $XAU