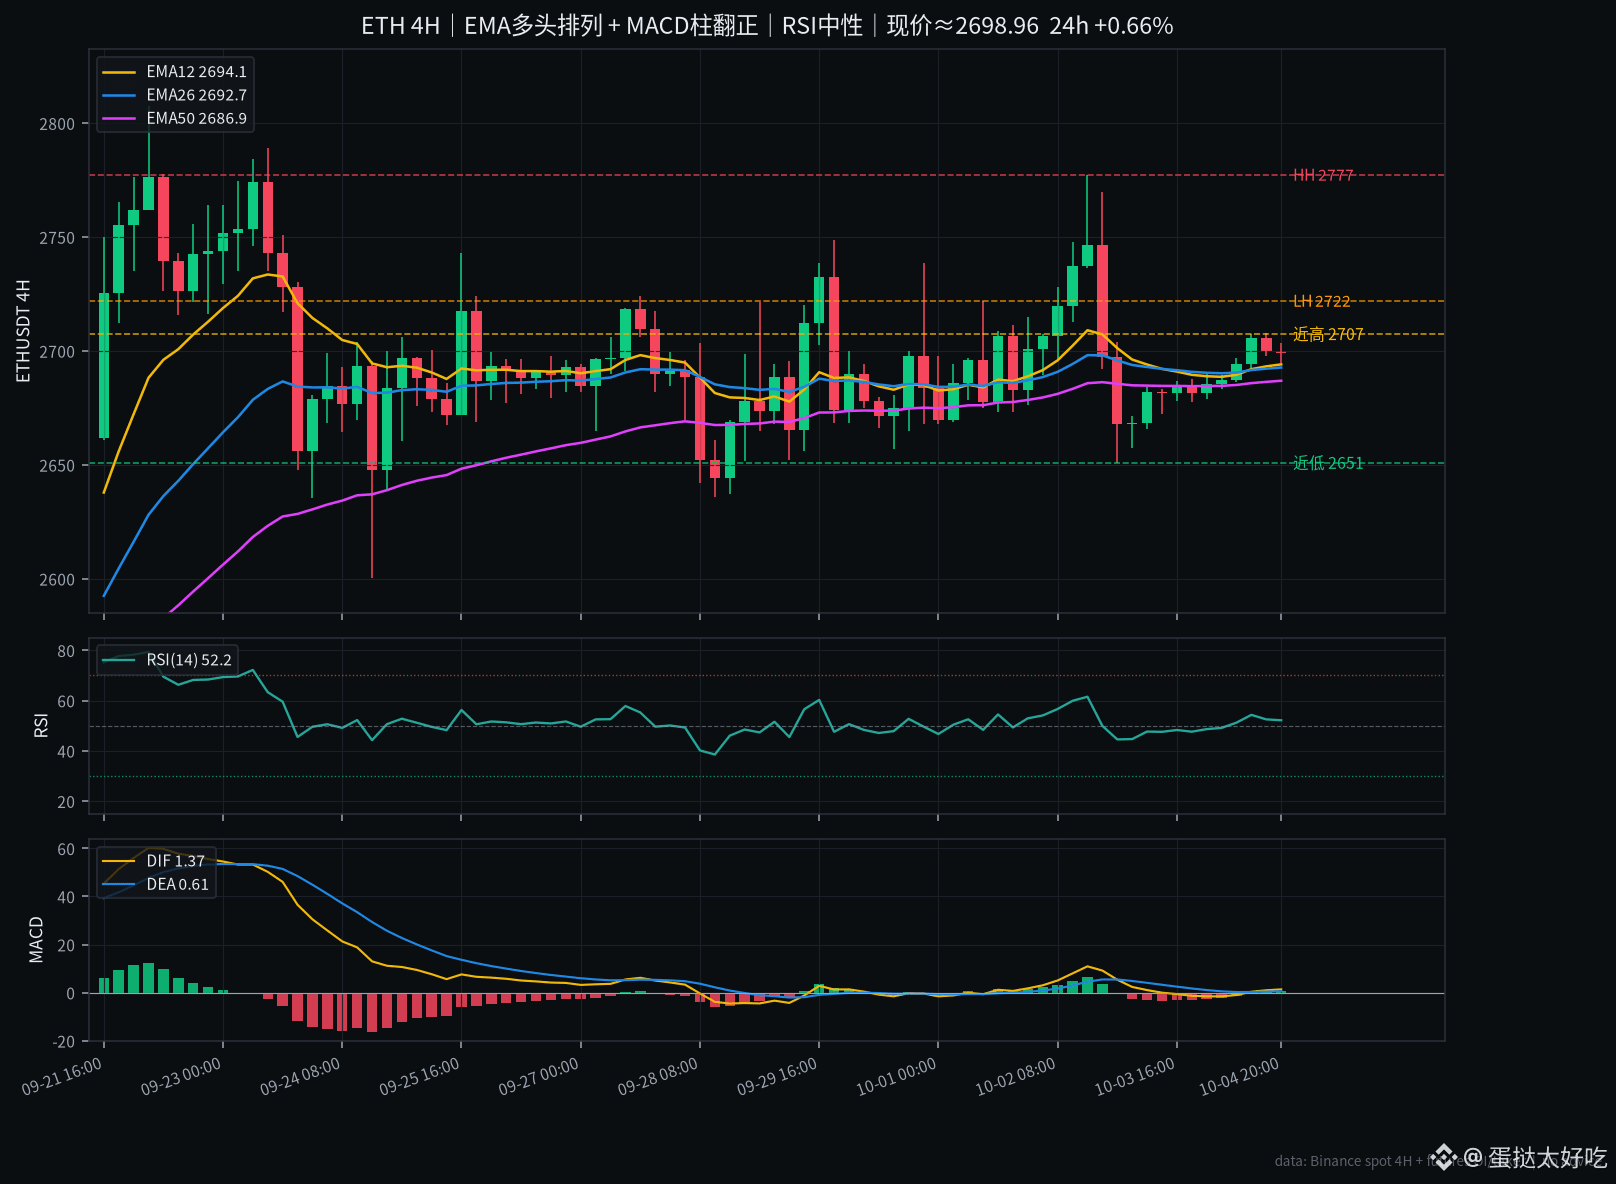
$ETH 4H The EMA12/26/50 is already arranged in a bullish alignment, and the MACD histogram has flipped from -3.1 all the way up to +0.76—it looks like a somersault confirming the upside. But the RSI is still hovering around 52 in the neutral zone, OI fell by 1.6% in a day, the taker buy/sell ratio dropped from 1.47 to 0.43, which looks more like de-leveraging followed by a rebound rather than a brand-new round of breakout adding.
The current price is about 2699, up +0.66% over 24h. EMA12/26/50 = 2694.1 / 2692.7 / 2686.9, and price is pressing just slightly above the 12. MACD(12,26,9): DIF +1.37 / DEA +0.61 / histogram +0.76; the histogram path is roughly -3.1 → -2.1 → -1.2 → +0.10 → +0.57 → +0.76. RSI(14) 4H = 52.2, 1H = 56.4—neither side is really hot.
Structurally, the HH is still at 2777, with LH steps left behind in the middle: 2748 → 2738 → 2722. After the recent low at 2651, the lows have been rising, but price is still stuck just below the previous high near 2707. Contract OI over 24h is -1.58%, funding rate is about +0.004%—almost no premium. The retail long/short ratio is still 2.71 and rather crowded, yet active orders are on the sell side.
The moving averages have nodded and the histogram has turned green, but positioning and active buying haven’t caught up. This looks more like shorts getting squeezed via covering than fresh longs lining up to enter. First watch the two sides at 2722 / 2687—break which side, then we talk direction.
#ETH #技术分析 #contract data
The current price is about 2699, up +0.66% over 24h. EMA12/26/50 = 2694.1 / 2692.7 / 2686.9, and price is pressing just slightly above the 12. MACD(12,26,9): DIF +1.37 / DEA +0.61 / histogram +0.76; the histogram path is roughly -3.1 → -2.1 → -1.2 → +0.10 → +0.57 → +0.76. RSI(14) 4H = 52.2, 1H = 56.4—neither side is really hot.
Structurally, the HH is still at 2777, with LH steps left behind in the middle: 2748 → 2738 → 2722. After the recent low at 2651, the lows have been rising, but price is still stuck just below the previous high near 2707. Contract OI over 24h is -1.58%, funding rate is about +0.004%—almost no premium. The retail long/short ratio is still 2.71 and rather crowded, yet active orders are on the sell side.
The moving averages have nodded and the histogram has turned green, but positioning and active buying haven’t caught up. This looks more like shorts getting squeezed via covering than fresh longs lining up to enter. First watch the two sides at 2722 / 2687—break which side, then we talk direction.
#ETH #技术分析 #contract data