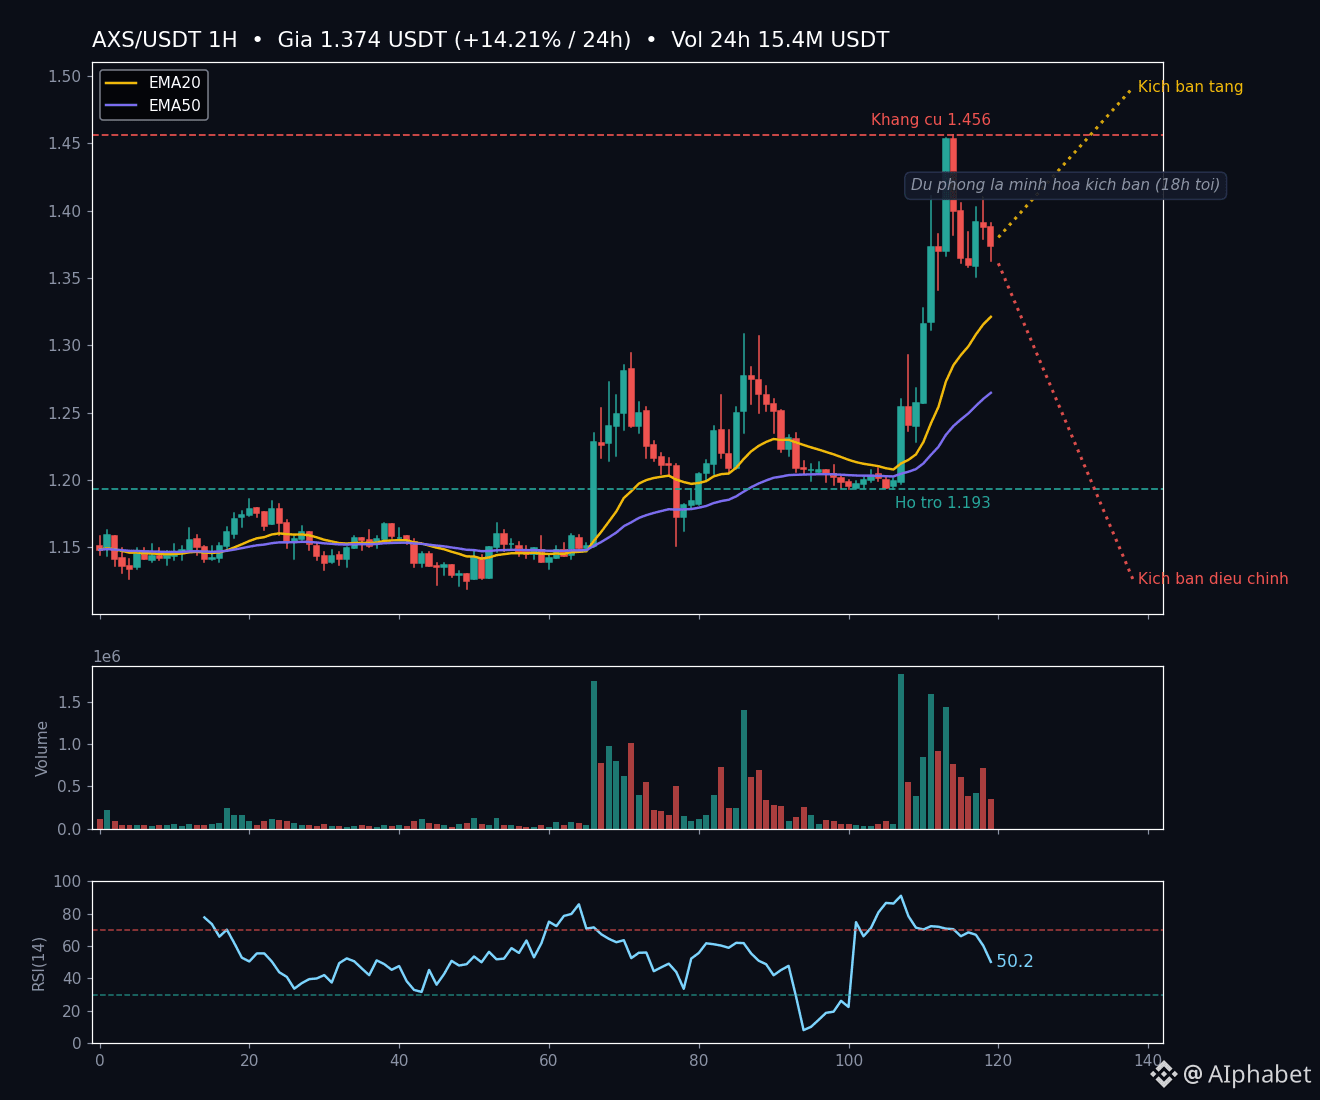
Bro, $AXS v just had a notable breakout: +14.21% in 24h, price is around 1.374 USDT with 24h volume ~15.4M USDT. This isn’t fake volume— the 1H candle shows real money flowing in.
Looking at the 1H chart, the story is pretty clear:
- Price bounced from the 1.15 area to the 24h high at 1.456; now it’s consolidating around 1.36–1.39 to absorb supply.
- EMA20 crossed above EMA50; price is above both lines—> the short-term trend still leans bullish.
- RSI(14) is about 50.2, cooling down from the previous overbought zone. That means the earlier up-move wasn’t pure FOMO-extreme, and there’s still room if the inflow returns.
Key resistance to watch:
- Resistance: 1.456 (the newly set high) —> a clean break opens the door to the 1.50+ zone.
- Support: 1.193 (the breakout-impulse low).
Two scenarios for the next 18h (see the projected path line on the chart):
- Upside scenario: price holds above EMA20 and breaks 1.456 with volume confirmation —> target 1.50.
- Pullback scenario: profit-taking pressure builds; if 1.36 breaks, it’s likely to retest support around 1.19–1.23.
$BTC is still range-bound around 85k, so altcoins are having their own separate waves. Bro trading short-term, time your entry properly—don’t chase green candles.
Analyze the data, not investment advice.
#AXS #Crypto #Trading
Looking at the 1H chart, the story is pretty clear:
- Price bounced from the 1.15 area to the 24h high at 1.456; now it’s consolidating around 1.36–1.39 to absorb supply.
- EMA20 crossed above EMA50; price is above both lines—> the short-term trend still leans bullish.
- RSI(14) is about 50.2, cooling down from the previous overbought zone. That means the earlier up-move wasn’t pure FOMO-extreme, and there’s still room if the inflow returns.
Key resistance to watch:
- Resistance: 1.456 (the newly set high) —> a clean break opens the door to the 1.50+ zone.
- Support: 1.193 (the breakout-impulse low).
Two scenarios for the next 18h (see the projected path line on the chart):
- Upside scenario: price holds above EMA20 and breaks 1.456 with volume confirmation —> target 1.50.
- Pullback scenario: profit-taking pressure builds; if 1.36 breaks, it’s likely to retest support around 1.19–1.23.
$BTC is still range-bound around 85k, so altcoins are having their own separate waves. Bro trading short-term, time your entry properly—don’t chase green candles.
Analyze the data, not investment advice.
#AXS #Crypto #Trading