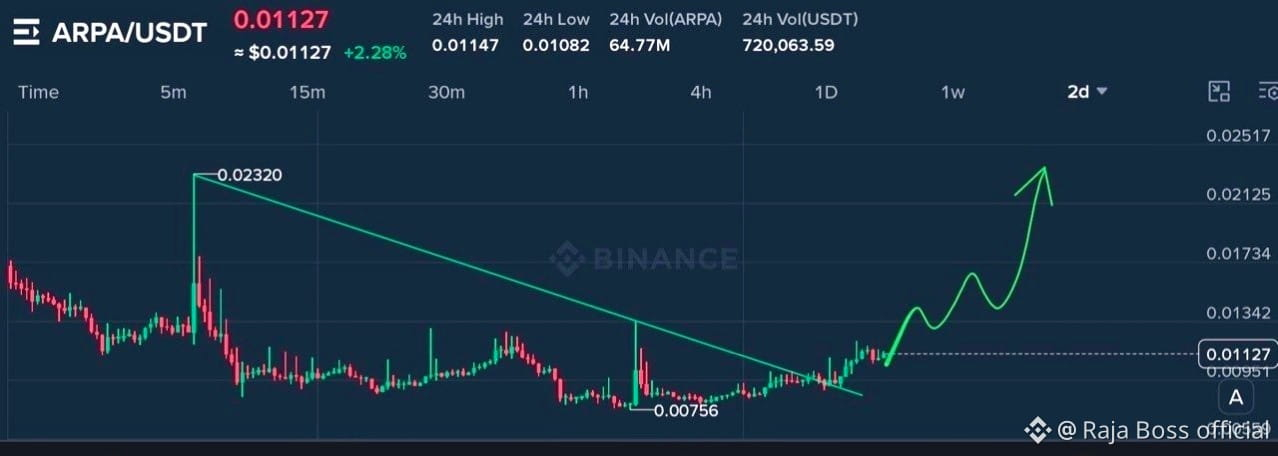

Guys, $ARPA a 2D trendline break
The chart shows a break and retest of the descending trendline.
The next test is whether the price can keep holding above that former resistance.
The chart shows a break and retest of the descending trendline.
The next test is whether the price can keep holding above that former resistance.