SOL/USDT Analysis — 4-hour Chart
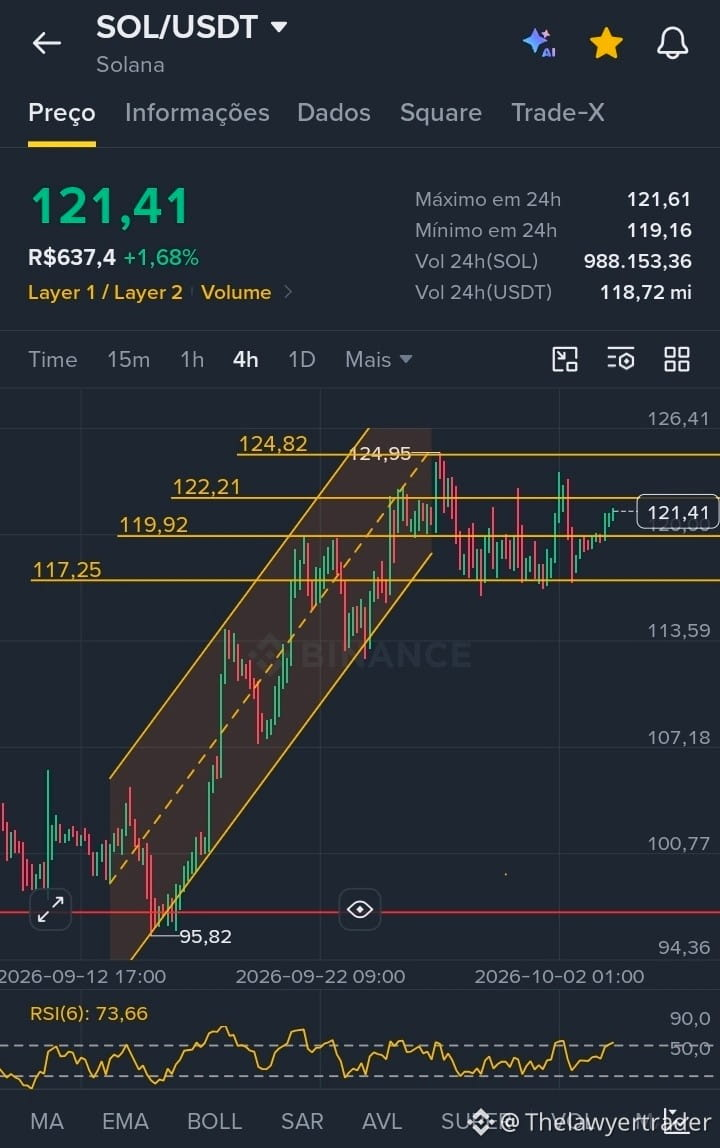
Solana (SOL) is trading at 121.41 USDT on the 4-hour chart, after breaking out of an ascending channel and entering a phase of sideways consolidation.
Visible chart pattern:
Broken ascending channel followed by consolidation between 117.25 and 122.21.
Supports: horizontal zone at 117.25.
Local resistances: 122.21 and 124.82.
Indicators:
RSI (6) at 73.66, indicating overbought conditions in the short term. This calls for caution with new aggressive entries until there is a correction or a confirmed support level.
Probability and scenario:
Consolidation pattern (medium probability of continuation): the asset is waiting for a trigger to define direction.
Bullish scenario: a sustained breakout above 122.21 with volume would pave the way to 124.82.
Bearish scenario: losing 117.25 could lead to a deeper correction, easing the overbought RSI.
Conclusion:
Wait-and-watch moment with risk management. Without confirmation of a breakout, the ideal approach is to wait for the price to respect support or break above resistance with volume before taking more aggressive positions.
⚠️ Informational analysis only, based on technical analysis. It does not constitute investment advice. Cryptoassets are volatile, so invest responsibly.
#solana #SolanaStrong $SOL
Solana (SOL) is trading at 121.41 USDT on the 4-hour chart, after breaking out of an ascending channel and entering a phase of sideways consolidation.
Visible chart pattern:
Broken ascending channel followed by consolidation between 117.25 and 122.21.
Supports: horizontal zone at 117.25.
Local resistances: 122.21 and 124.82.
Indicators:
RSI (6) at 73.66, indicating overbought conditions in the short term. This calls for caution with new aggressive entries until there is a correction or a confirmed support level.
Probability and scenario:
Consolidation pattern (medium probability of continuation): the asset is waiting for a trigger to define direction.
Bullish scenario: a sustained breakout above 122.21 with volume would pave the way to 124.82.
Bearish scenario: losing 117.25 could lead to a deeper correction, easing the overbought RSI.
Conclusion:
Wait-and-watch moment with risk management. Without confirmation of a breakout, the ideal approach is to wait for the price to respect support or break above resistance with volume before taking more aggressive positions.
⚠️ Informational analysis only, based on technical analysis. It does not constitute investment advice. Cryptoassets are volatile, so invest responsibly.
#solana #SolanaStrong $SOL