$1,325 worth of ZEC—do you dare to chase it?
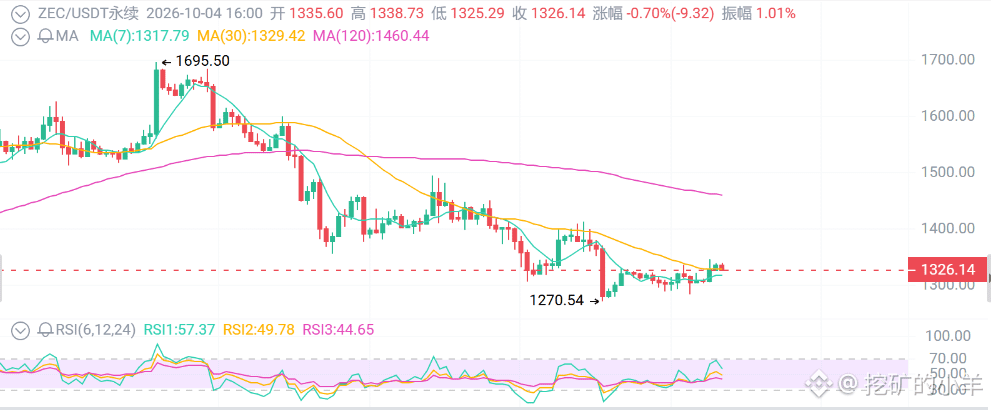
First, look at the surface: ZEC has been smashed from 1,698 on September 26 down to 1,271 on October 3—25% gone. Today it climbed back from 1,271 to 1,325, seemingly stabilizing. The 24-hour low is 1,284 and the high is 1,341. Trading isn’t small, but—perpetual futures open interest is 640 million; as price rises, positioning doesn’t increase. This is a rebound, not a trend.
First thing: the narrative hasn’t broken, but the money is moving out.
Grayscale’s Zcash spot ETF saw net redemptions of $93.56 million last week. After it launched in August, it was an important incremental driver for this move—from a few hundred dollars up to 1,700.
So what now? The honeymoon period is over.
THORChain’s ZEC pool launched on October 2—sounds bullish? But the native swaps aren’t fully opened yet, and the pool depth is shallow. This is a channel, not buy-side demand.
Second thing: BTC is fine, but it hasn’t helped.
BTC is at 84,900–85,000, still sitting in the upper half of the 83,000–87,200 range box. After the employment data, rate-hike expectations eased, but the 10-year Treasury yield rebounded—risk appetite hasn’t restarted.
Next hard data: October 14 inflation.
This ZEC pullback isn’t led by BTC—it’s because ZEC already ran too much, and profit-takers are exiting. But if BTC breaks below 83,100 in a sustained way, the relative strength of privacy coins will also get pressed down.
Third thing: the technicals tell you a harsh fact.
Daily: RSI has returned to 50, completely cooling off from overbought. Price is still above the 50-day moving average (around 1,080). The 50-day line is above the 200-day—bull structure hasn’t broken.
4-hour: the descending structure from 1,698 hasn’t been broken. Today’s rebound stalled around 1,340; the 4-hour RSI is about 39, still rebounding within the bearish zone.
If the daily close holds above 1,370, the pullback would be considered over; the target is 1,449.
If it closes below 1,271, the repair fails; the next support level is 1,244.
Trading strategy
1. 1,325 is the midline during the rebound; above it are 1,341/1,370. Wait for the 4-hour close to firm above 1,370 with volume, then look at 1,449. Stop-loss: close back below 1,320.
2. Buy on pullbacks.
Prioritize waiting for 1,284–1,271 to show a stop-hunt reversal again (long lower wicks). Then enter in batches. Stop-loss is below 1,255. First target: 1,340. Once it holds, then look at 1,370.
3. Short only when resistance holds (for the short term).
Rebound shorts around 1,366–1,370 if there’s volume with upper-wick rejections. If the 4-hour chart can’t reclaim it, take a light position short; stop-loss above 1,390; targets 1,284/1,271. Don’t try to guess the top in the middle around 1,325—daily RSI is already back to neutral.
4. Invalidation conditions
If the daily close falls below 1,271 and can’t get back above it, pull back longs. If the ETF continues to see large-scale redemptions, downgrade the breakout longs above 1,370.
First, look at the surface: ZEC has been smashed from 1,698 on September 26 down to 1,271 on October 3—25% gone. Today it climbed back from 1,271 to 1,325, seemingly stabilizing. The 24-hour low is 1,284 and the high is 1,341. Trading isn’t small, but—perpetual futures open interest is 640 million; as price rises, positioning doesn’t increase. This is a rebound, not a trend.
First thing: the narrative hasn’t broken, but the money is moving out.
Grayscale’s Zcash spot ETF saw net redemptions of $93.56 million last week. After it launched in August, it was an important incremental driver for this move—from a few hundred dollars up to 1,700.
So what now? The honeymoon period is over.
THORChain’s ZEC pool launched on October 2—sounds bullish? But the native swaps aren’t fully opened yet, and the pool depth is shallow. This is a channel, not buy-side demand.
Second thing: BTC is fine, but it hasn’t helped.
BTC is at 84,900–85,000, still sitting in the upper half of the 83,000–87,200 range box. After the employment data, rate-hike expectations eased, but the 10-year Treasury yield rebounded—risk appetite hasn’t restarted.
Next hard data: October 14 inflation.
This ZEC pullback isn’t led by BTC—it’s because ZEC already ran too much, and profit-takers are exiting. But if BTC breaks below 83,100 in a sustained way, the relative strength of privacy coins will also get pressed down.
Third thing: the technicals tell you a harsh fact.
Daily: RSI has returned to 50, completely cooling off from overbought. Price is still above the 50-day moving average (around 1,080). The 50-day line is above the 200-day—bull structure hasn’t broken.
4-hour: the descending structure from 1,698 hasn’t been broken. Today’s rebound stalled around 1,340; the 4-hour RSI is about 39, still rebounding within the bearish zone.
If the daily close holds above 1,370, the pullback would be considered over; the target is 1,449.
If it closes below 1,271, the repair fails; the next support level is 1,244.
Trading strategy
1. 1,325 is the midline during the rebound; above it are 1,341/1,370. Wait for the 4-hour close to firm above 1,370 with volume, then look at 1,449. Stop-loss: close back below 1,320.
2. Buy on pullbacks.
Prioritize waiting for 1,284–1,271 to show a stop-hunt reversal again (long lower wicks). Then enter in batches. Stop-loss is below 1,255. First target: 1,340. Once it holds, then look at 1,370.
3. Short only when resistance holds (for the short term).
Rebound shorts around 1,366–1,370 if there’s volume with upper-wick rejections. If the 4-hour chart can’t reclaim it, take a light position short; stop-loss above 1,390; targets 1,284/1,271. Don’t try to guess the top in the middle around 1,325—daily RSI is already back to neutral.
4. Invalidation conditions
If the daily close falls below 1,271 and can’t get back above it, pull back longs. If the ETF continues to see large-scale redemptions, downgrade the breakout longs above 1,370.