$263 for QNT—would you dare to buy?
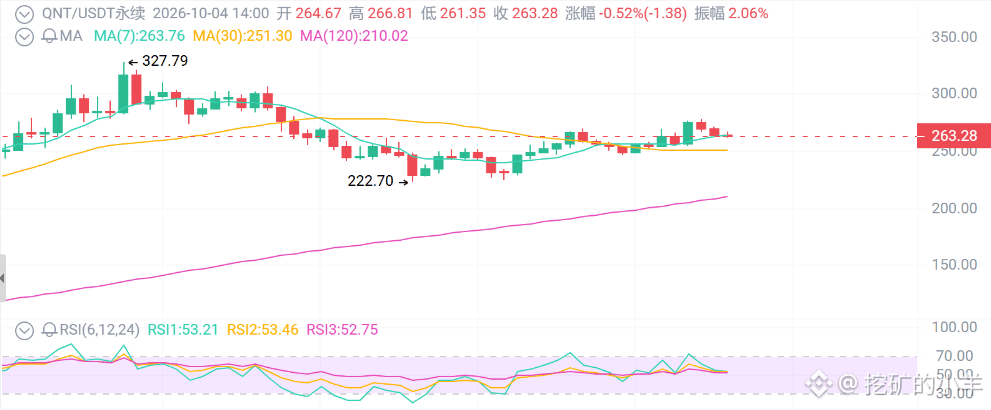
First, the surface picture: In the past two weeks, QNT went from around 70 all the way to 373, a 5x increase. Then what? It dropped back to 223 in two days, and now it’s rebounding to 263. In the past 24 hours, trading volume was huge, and leveraged positions surged to as high as $170 million—an all-time record.
What the candlesticks tell you: On the daily chart, price is still above all moving averages. RSI is around 72, which is overbought. On the 4-hour chart, a converging triangle has formed, with support at 245–256 and resistance at 278–287. The triangle will break—yet nobody knows which direction.
First thing: The news is real, but you might be overthinking it.
On September 24, The Clearing House selected Quant for the technical layer of the OnChain Money Initiative.
What is TCH? About 25 U.S. large banks hold it, with daily settlement of over $2 trillion. The system connects RTP and CHIPS, and the target for member bank operating hours is the first half of 2027.
On September 26, seven UK banks—including Barclays, HSBC, and Lloyds—completed the first real-client tokenized GBP deposit payment on the Quant platform.
Banks chose Quant’s technology, but they didn’t say they would buy QNT.
Neither TCH nor Quant said participation by banks requires buying QNT.
Second thing: Why could it rise from 70 to 373? Because the float is thin.
QNT circulating supply is only about 14.6 million; the rest has already been burned, unlocks are over, and there’s no new selling pressure.
Thin float + bank narrative + leveraged inflows = a surge.
By late September, positions reached a record $170 million. Leverage is a magnifier—when it goes up it feels great, but when it falls, 40% can disappear in two days.
Third thing: The technicals say right now is the worst risk-reward spot—in the middle of the triangle.
Daily: Price is still above all moving averages, but RSI 72 is overbought.
4-hour: The repair from 223 has played out, and it formed a converging triangle. Support at 245–256; resistance at 278–287.
Today it surged to 278 and then slipped back to 263—this was the first rejection near the upper boundary of the triangle.
Trading strategy
1. Wait for the 4-hour close to hold above 278 with increased volume, then reassess 287. Stop loss if price falls back below 268. Only if above 287 should you talk about 300.
2. Buy on pullback. Prefer to wait for a reversal signal with long lower wicks within 256–245, then enter in batches. Stop loss below 238. First target 278; if it holds, then look at 287.
3. For short-term shorts, only trade when price is rejected. If there’s a volume-backed upper-wick rejection near 278–287 and price can’t reclaim, short with a small position. Stop loss above 292. Targets 256/245. Don’t guess the top in the middle at 263.
4. If the daily close breaks below 245, exit longs. The next level to watch is 223. A valid break below 223 would turn this move from a “pump and pullback” into a “deeper correction,” with the target shifting down to 195.
First, the surface picture: In the past two weeks, QNT went from around 70 all the way to 373, a 5x increase. Then what? It dropped back to 223 in two days, and now it’s rebounding to 263. In the past 24 hours, trading volume was huge, and leveraged positions surged to as high as $170 million—an all-time record.
What the candlesticks tell you: On the daily chart, price is still above all moving averages. RSI is around 72, which is overbought. On the 4-hour chart, a converging triangle has formed, with support at 245–256 and resistance at 278–287. The triangle will break—yet nobody knows which direction.
First thing: The news is real, but you might be overthinking it.
On September 24, The Clearing House selected Quant for the technical layer of the OnChain Money Initiative.
What is TCH? About 25 U.S. large banks hold it, with daily settlement of over $2 trillion. The system connects RTP and CHIPS, and the target for member bank operating hours is the first half of 2027.
On September 26, seven UK banks—including Barclays, HSBC, and Lloyds—completed the first real-client tokenized GBP deposit payment on the Quant platform.
Banks chose Quant’s technology, but they didn’t say they would buy QNT.
Neither TCH nor Quant said participation by banks requires buying QNT.
Second thing: Why could it rise from 70 to 373? Because the float is thin.
QNT circulating supply is only about 14.6 million; the rest has already been burned, unlocks are over, and there’s no new selling pressure.
Thin float + bank narrative + leveraged inflows = a surge.
By late September, positions reached a record $170 million. Leverage is a magnifier—when it goes up it feels great, but when it falls, 40% can disappear in two days.
Third thing: The technicals say right now is the worst risk-reward spot—in the middle of the triangle.
Daily: Price is still above all moving averages, but RSI 72 is overbought.
4-hour: The repair from 223 has played out, and it formed a converging triangle. Support at 245–256; resistance at 278–287.
Today it surged to 278 and then slipped back to 263—this was the first rejection near the upper boundary of the triangle.
Trading strategy
1. Wait for the 4-hour close to hold above 278 with increased volume, then reassess 287. Stop loss if price falls back below 268. Only if above 287 should you talk about 300.
2. Buy on pullback. Prefer to wait for a reversal signal with long lower wicks within 256–245, then enter in batches. Stop loss below 238. First target 278; if it holds, then look at 287.
3. For short-term shorts, only trade when price is rejected. If there’s a volume-backed upper-wick rejection near 278–287 and price can’t reclaim, short with a small position. Stop loss above 292. Targets 256/245. Don’t guess the top in the middle at 263.
4. If the daily close breaks below 245, exit longs. The next level to watch is 223. A valid break below 223 would turn this move from a “pump and pullback” into a “deeper correction,” with the target shifting down to 195.