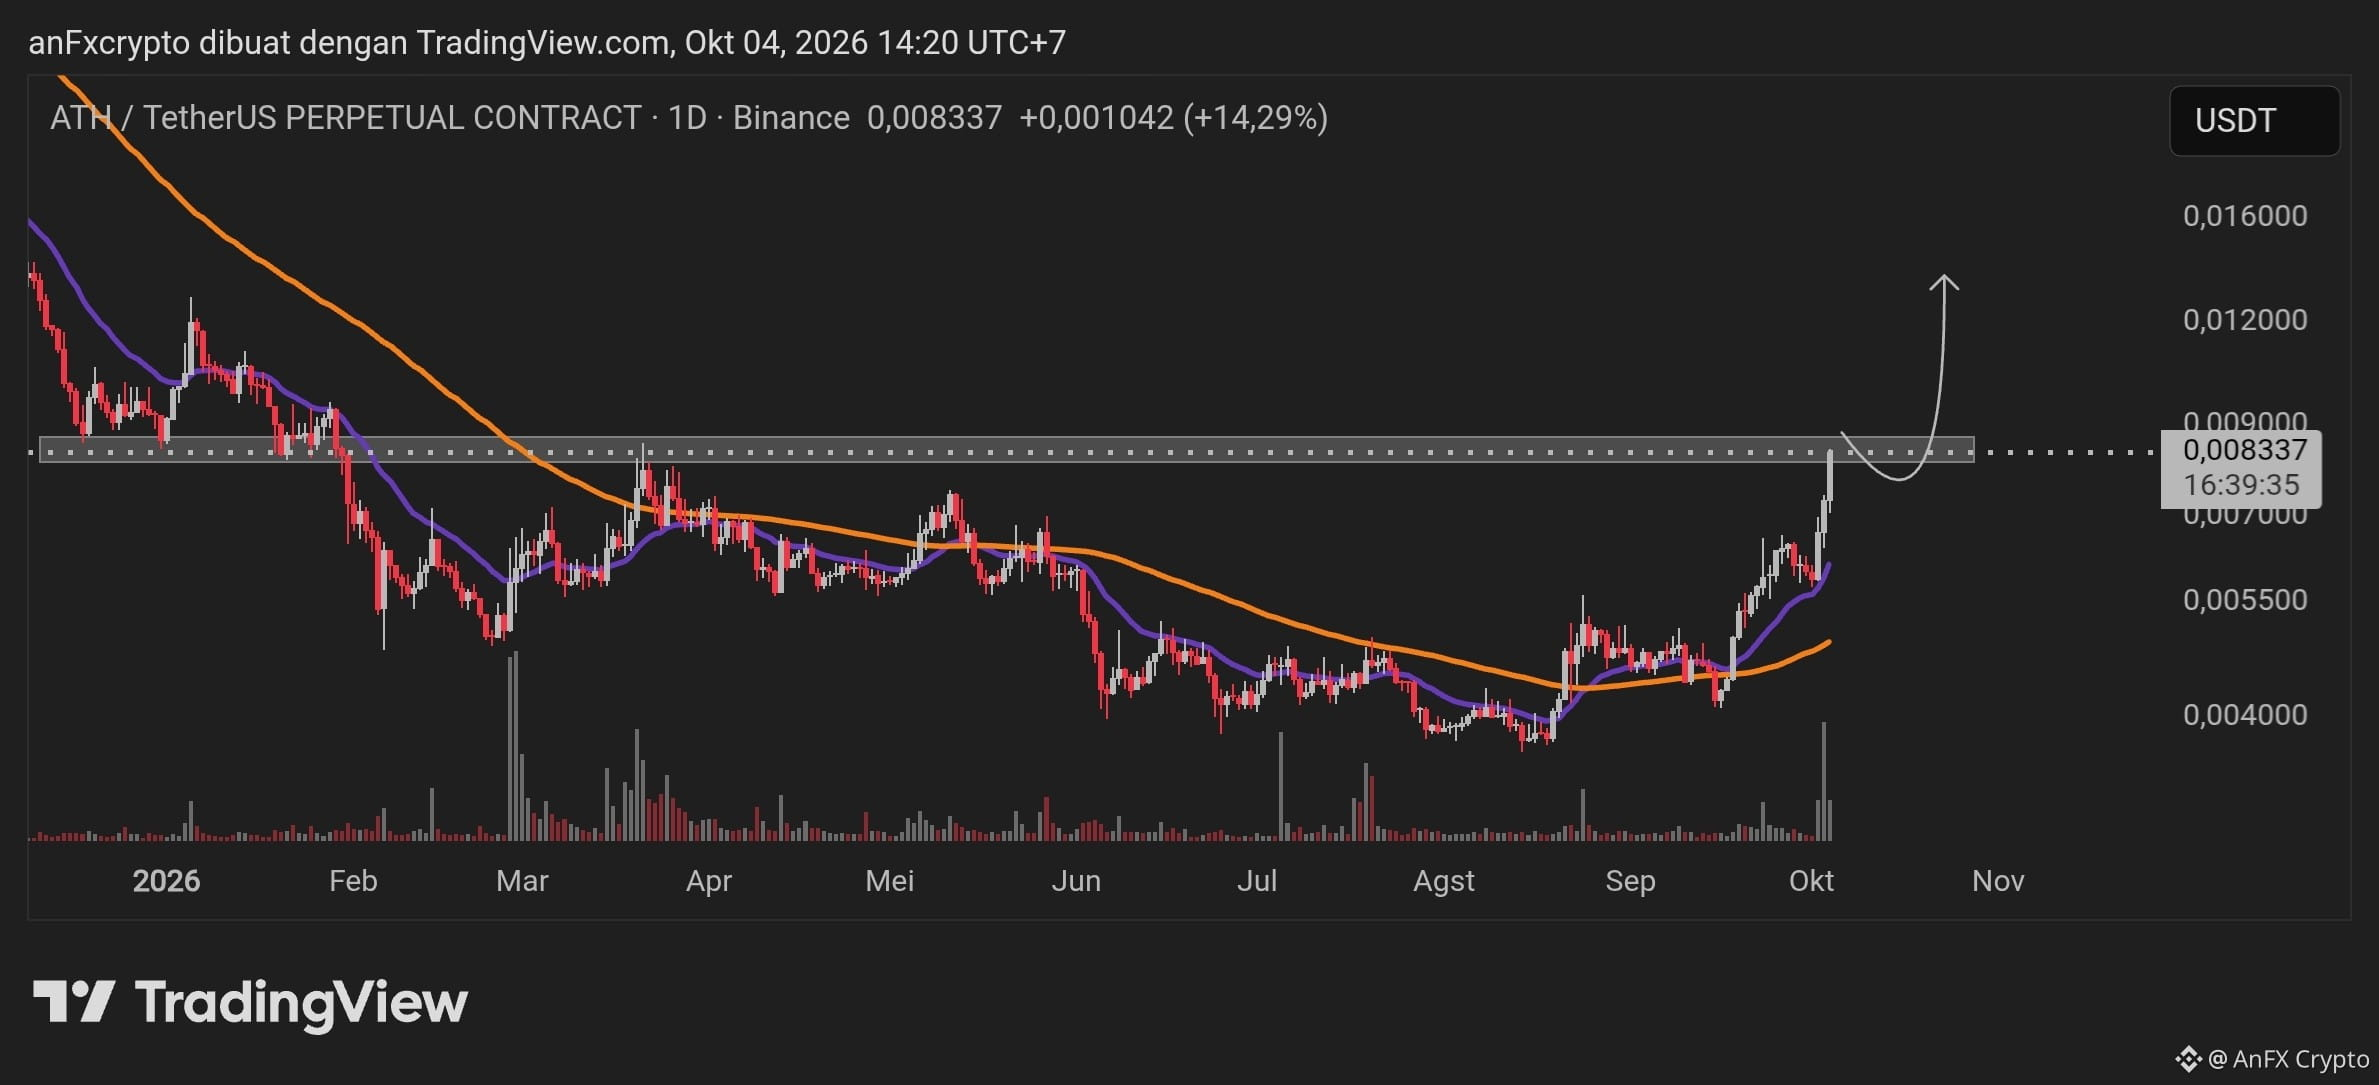
Here is a technical analysis and trading signal setup for $ATH /USDT Perpetual Contract (Timeframe 1D)
Technical Market Analysis
Trend Structure & Pattern (Trend Reversal):
Accumulation Phase Complete: After experiencing a long downtrend from the beginning of 2026 (peak above $0.0160 to the low around $0.0038), price has formed a base (bottoming phase) in the $0.0038–$0.0050 area.
Breakout Moving Average: Price has successfully broken above the long-term Moving Average (orange line) and is supported by the short-term MA (purple line), which is now acting as dynamic support.
Key Resistance Area / Supply Zone:
Currently, price is at $0.008337 (+14.29%) and is testing a key resistance area in the $0.0080 – $0.0088 range (gray zone).
A strong daily candle close above $0.0088 will confirm the continuation of the uptrend (bullish continuation) toward the next target at $0.0130 – $0.0150.
Trading Signals (Swing Long Setup)
Trade Type: BUY / LONG (Breakout & Retest Strategy)
Entry Zone (Buy): $0.0080 – $0.0085 (sweet retest/pullback area within the new support zone)
Take Profit (TP):
TP 1: $0.0105 (first psychological area)
TP 2: $0.0125 (next local swing high)
TP 3: $0.0150 (Major Resistance / projected arrow target)
Stop Loss (SL): $0.0068 (below MA support & the last swing low structure)
Risk to Reward Ratio (RRR): ~ 1 : 3.2
Risk Management Notes
Candle Confirmation: It is recommended to wait for the daily candle close confirmation to avoid fakeouts in the resistance zone.
Leverage & Capital Allocation: If using Futures, limit leverage to 3x – 5x and allocate a maximum of 1% – 2% of total capital per trade.
Technical Market Analysis
Trend Structure & Pattern (Trend Reversal):
Accumulation Phase Complete: After experiencing a long downtrend from the beginning of 2026 (peak above $0.0160 to the low around $0.0038), price has formed a base (bottoming phase) in the $0.0038–$0.0050 area.
Breakout Moving Average: Price has successfully broken above the long-term Moving Average (orange line) and is supported by the short-term MA (purple line), which is now acting as dynamic support.
Key Resistance Area / Supply Zone:
Currently, price is at $0.008337 (+14.29%) and is testing a key resistance area in the $0.0080 – $0.0088 range (gray zone).
A strong daily candle close above $0.0088 will confirm the continuation of the uptrend (bullish continuation) toward the next target at $0.0130 – $0.0150.
Trading Signals (Swing Long Setup)
Trade Type: BUY / LONG (Breakout & Retest Strategy)
Entry Zone (Buy): $0.0080 – $0.0085 (sweet retest/pullback area within the new support zone)
Take Profit (TP):
TP 1: $0.0105 (first psychological area)
TP 2: $0.0125 (next local swing high)
TP 3: $0.0150 (Major Resistance / projected arrow target)
Stop Loss (SL): $0.0068 (below MA support & the last swing low structure)
Risk to Reward Ratio (RRR): ~ 1 : 3.2
Risk Management Notes
Candle Confirmation: It is recommended to wait for the daily candle close confirmation to avoid fakeouts in the resistance zone.
Leverage & Capital Allocation: If using Futures, limit leverage to 3x – 5x and allocate a maximum of 1% – 2% of total capital per trade.