Technical Analysis: $COLLECT /USDT Perpetual (1D)
Market Structure & Trend Direction:
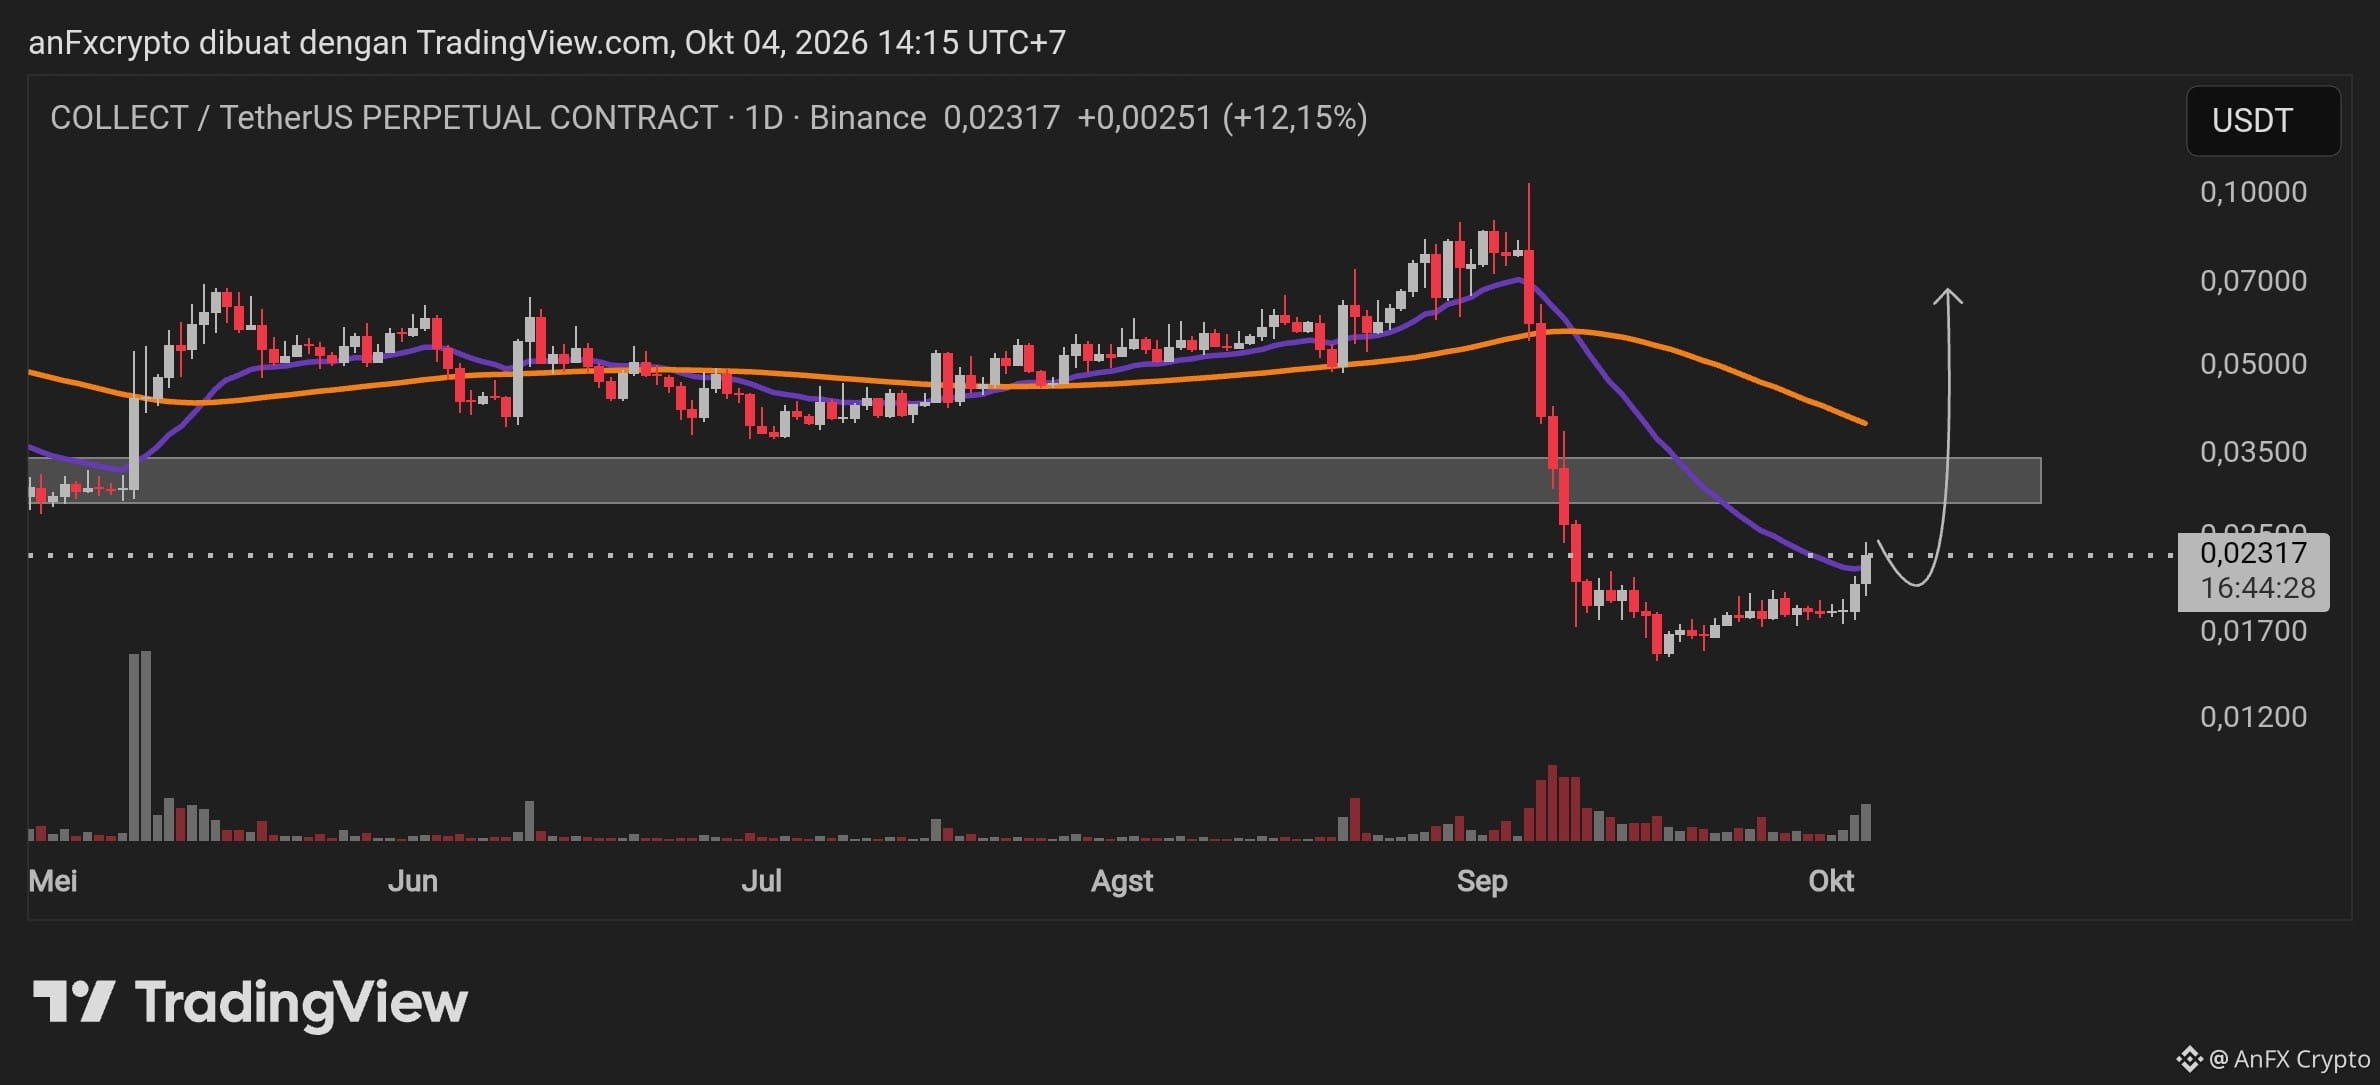
Rebound from Local Bottom: After a sharp drop from its peak in the range of $0.09000 – $0.10000 to hit the local bottom at $0.01700, the price has started showing signs of consolidation and accumulation.
Testing Dynamic Resistance: The current price is at $0.02317 (+12.15%) and is beginning to attempt a break upward through the short-term Moving Average (purple line).
Main Resistance Zone (Gray Box): The area $0.03000 – $0.03500 was previously a support breakdown level that is now acting as strong resistance. This area becomes the initial target to test the strength of the relief rally.
Price Movement Projection:
Bullish Scenario (Primary): There is a push that carries the price beyond the short MA toward the resistance zone $0.03000 – $0.03500. If this area is successfully broken with high volume, the strength may continue toward the long-term MA (orange line) at $0.05000, with a potential target up to $0.07000.
Bearish Scenario (Invalidation): A strong rejection below $0.02500 or a drop below the $0.01700 support will invalidate this reversal structure.
Trading Plan & Signals
Trade Direction: LONG / BUY
Entry Area: $0.02150 – $0.02320 (staged entries in the current consolidation area)
Take Profit Targets (TP):
TP 1: $0.03000 (lower bound of gray resistance)
TP 2: $0.03500 (upper bound of gray resistance)
TP 3: $0.05000 (Dynamic Orange MA Area)
TP 4: $0.07000 (extended swing target)
Stop Loss (SL): $0.01650 (placed below the swing low of $0.01700)
Risk/Reward Ratio: ~ 1 : 2.5+
Leverage Recommendation: Max 3x – 5x (Futures/Perpetual)
Risk Management
Position Sizing: Limit the maximum risk allocation to 1% – 2% of the total account equity for this trade.
Volume Confirmation: Watch for a spike in buy volume to ensure the move is not a fakeout before adding to the position.
Stop Loss Adjustment: If price reaches TP 1 ($0.03000), move the Stop Loss to the Break Even Point (BEP) area to lock the position against loss risk.
Market Structure & Trend Direction:
Rebound from Local Bottom: After a sharp drop from its peak in the range of $0.09000 – $0.10000 to hit the local bottom at $0.01700, the price has started showing signs of consolidation and accumulation.
Testing Dynamic Resistance: The current price is at $0.02317 (+12.15%) and is beginning to attempt a break upward through the short-term Moving Average (purple line).
Main Resistance Zone (Gray Box): The area $0.03000 – $0.03500 was previously a support breakdown level that is now acting as strong resistance. This area becomes the initial target to test the strength of the relief rally.
Price Movement Projection:
Bullish Scenario (Primary): There is a push that carries the price beyond the short MA toward the resistance zone $0.03000 – $0.03500. If this area is successfully broken with high volume, the strength may continue toward the long-term MA (orange line) at $0.05000, with a potential target up to $0.07000.
Bearish Scenario (Invalidation): A strong rejection below $0.02500 or a drop below the $0.01700 support will invalidate this reversal structure.
Trading Plan & Signals
Trade Direction: LONG / BUY
Entry Area: $0.02150 – $0.02320 (staged entries in the current consolidation area)
Take Profit Targets (TP):
TP 1: $0.03000 (lower bound of gray resistance)
TP 2: $0.03500 (upper bound of gray resistance)
TP 3: $0.05000 (Dynamic Orange MA Area)
TP 4: $0.07000 (extended swing target)
Stop Loss (SL): $0.01650 (placed below the swing low of $0.01700)
Risk/Reward Ratio: ~ 1 : 2.5+
Leverage Recommendation: Max 3x – 5x (Futures/Perpetual)
Risk Management
Position Sizing: Limit the maximum risk allocation to 1% – 2% of the total account equity for this trade.
Volume Confirmation: Watch for a spike in buy volume to ensure the move is not a fakeout before adding to the position.
Stop Loss Adjustment: If price reaches TP 1 ($0.03000), move the Stop Loss to the Break Even Point (BEP) area to lock the position against loss risk.